


Momentum
5.5
Where the KSE-100 trades against its own recent trend. Strong, persistent upside reads as greed.

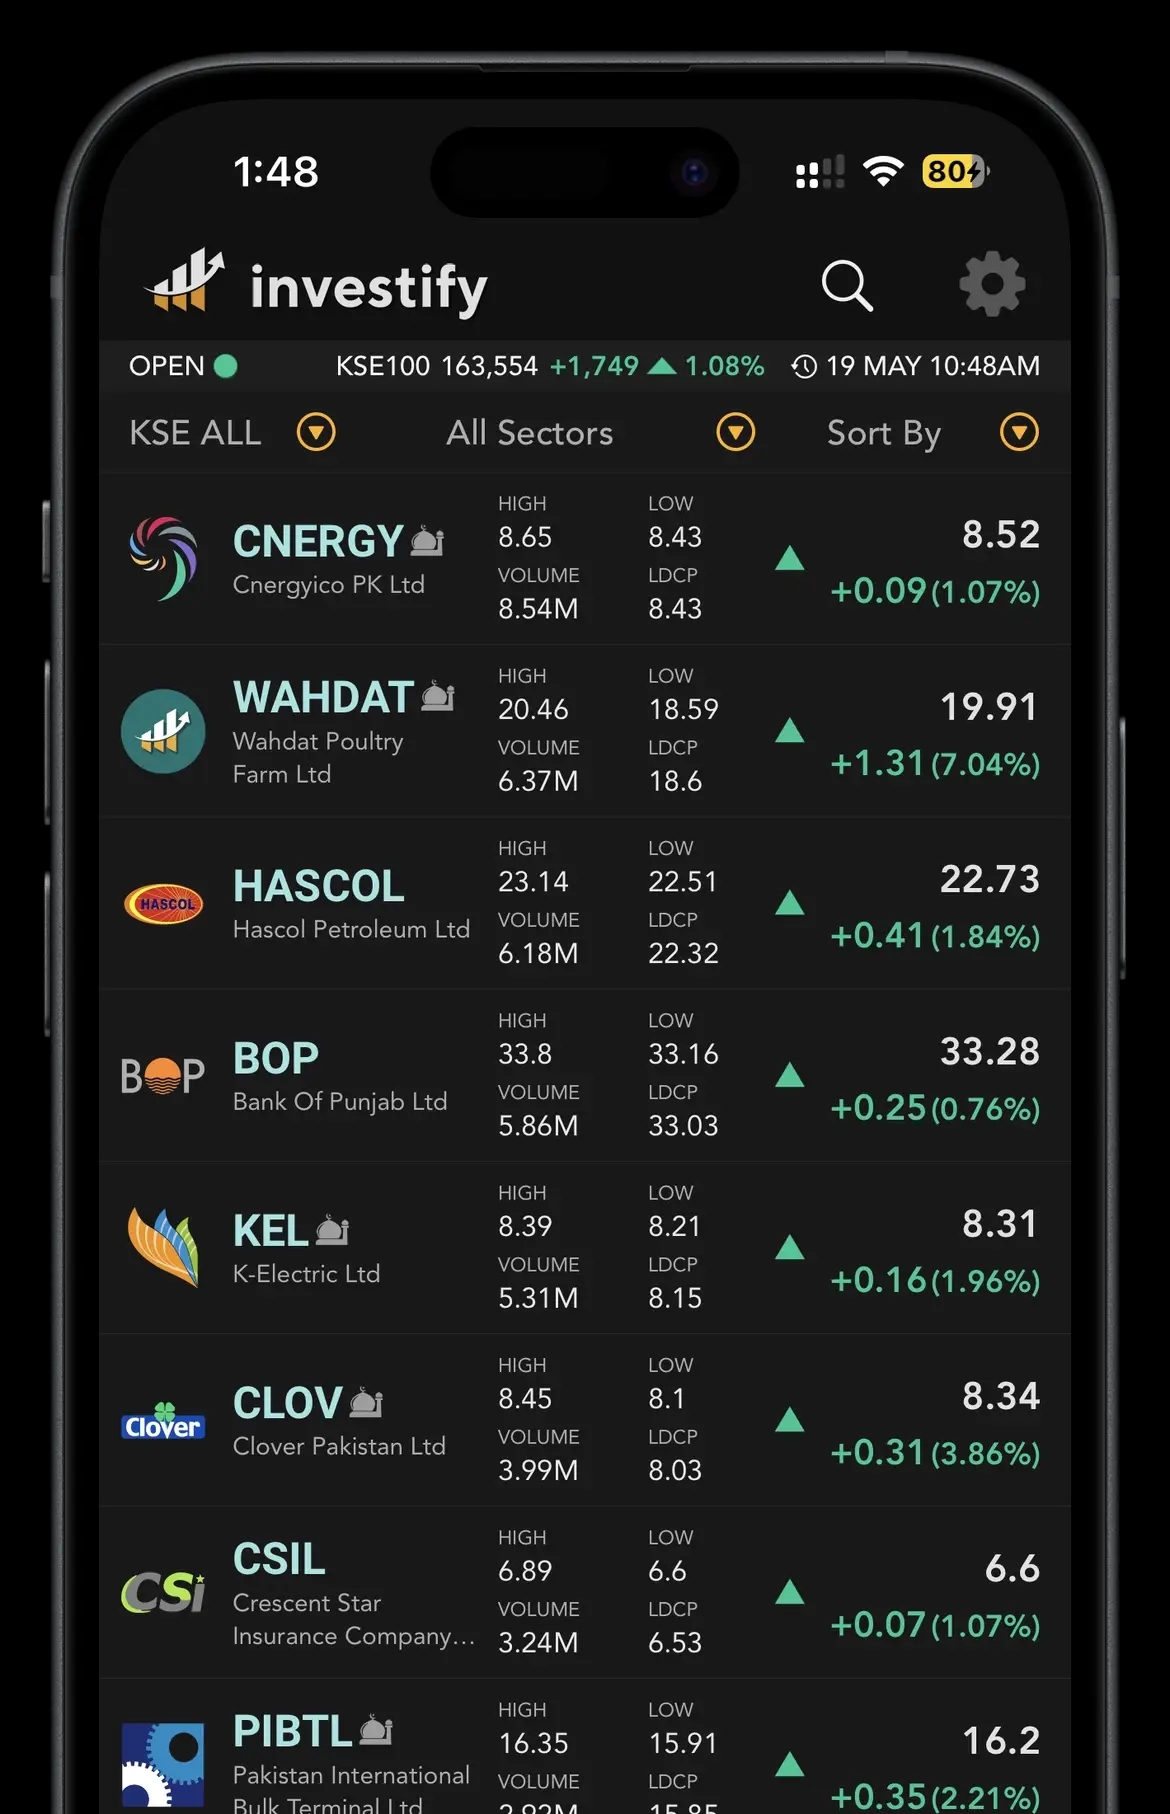
Built for PSX investors
Follow live PSX prices, track holdings, read business news, and keep your watchlist close before the market moves.
Market sentiment
One number for the mood of the Pakistan Stock Exchange. Market trends, participation and risk appetite combined into a daily 0 to 100 reading.
The latest available reading of Investify's PSX Fear & Greed Index is 30.7 out of 100 (Fear), for Friday, 9 Oct 2026. It measures daily market sentiment, not intraday prices or a forecast.
Previous close
30.2
Fear
1 week ago
34.4
Fear
1 month ago
28.5
Extreme Fear
1 year ago
42.0
Fear
PSX Fear & Greed Index
As of Friday, 9 Oct 2026 · updates nightly after market close
Sentiment over time
Sentiment swings in cycles: fear rarely lasts, and neither does euphoria. The bands mark the five zones, so you can see how today's reading compares with every session before it.
13 Oct 2025 to 9 Oct 2026
+4.8 ptsWhat's driving it
Signals are ranked from 0 to 100 within their available historical windows. The reading combines 8 available signals using the weights described below.
Where the KSE-100 trades against its own recent trend. Strong, persistent upside reads as greed.
How turbulent daily KSE-100 moves are versus the past ten weeks. Calm tape reads as greed, chop reads as fear.
Buying and selling participation across liquid stocks over five sessions.
How many liquid PSX stocks sit near their 52-week highs versus stuck at 52-week lows.
The direction and size of daily KSE-100 returns, weighted by market activity over 20 sessions.
Two-week returns on gold in rupees and the US dollar versus the KSE-100. Money hiding in gold reads as fear.
Speculative appetite in PSX futures: how much trading migrates to leverage and how much open interest builds.
Foreign net buying and selling relative to liquid-stock turnover. Early readings use a limited history.
How to read it
Read the overall zone alongside the component breakdown. A sentiment score does not measure company value or establish what caused a price move. For examples and the calculation details, read our complete guide to the PSX Fear & Greed Index.
The combined signals indicate very weak sentiment. This is not evidence that stocks are undervalued or that a recovery is imminent.
Caution rules the market. Buyers are selective, volumes are hesitant, and good news gets discounted. A common zone during consolidations.
The combined signals fall in the middle band. Individual components can still disagree sharply; neutral does not mean low risk.
Optimism is broadening. Rallies attract volume and dips get bought quickly. Trends often continue here, but discipline on position sizing matters.
The combined signals indicate very strong sentiment. This does not establish that a market reversal is imminent or that every stock is rising.
The index is an information tool, not investment advice. It describes market sentiment; it does not recommend buying or selling any security. Investing in equities involves risk, including the loss of principal. Do your own research or consult a licensed advisor.
Methodology
Methodology version 2 · revision reference date: 4 September 2026
The history shown here has been recalculated using this methodology, including dates before the revision. These historical values can differ from previously published readings.
Five-session breadth and continuous, turnover-weighted returns reduce abrupt formula changes. We do not apply additional smoothing to the final score.
Each raw signal is ranked within up to 500 sessions of its own history, with risk-oriented signals inverted. Core signals need 250 valid observations. FIPI can participate after 20 valid rolling observations (normally 39 complete daily flow reports); its short-history score has a limited initial weight. Missing inputs are excluded rather than treated as zero.
Momentum and price strength each have weight 0.5 to reduce overlapping trend exposure. FIPI has provisional weight 0.25 (4% when all signals qualify); each other signal has weight 1. We divide the weighted sum by the available weights and require at least four core signals. Weights do not automatically increase with time.
The nightly calculation uses available market data, gold and currency prices, futures activity and FIPIForeign Investor Portfolio Investment: the net value foreign investors bought or sold on the PSX. Persistent foreign buying tends to support the market; persistent selling weighs on it. flows. Publication depends on usable inputs and successful processing. Check the displayed trading date; a page refresh does not itself produce a new reading.
Momentum
Compares the KSE-100's 30-session trend against its 90-session trend, scaled by the long average.
Volatility
20-session realized volatility of KSE-100 returns against its own 50-session average, inverted.
Breadth
Five-session advancing minus declining traded-value estimates, divided by their sum. Unchanged stocks are excluded.
Price Strength
Share of the liquid universe within 5% of its 52-week high minus the share near its 52-week low.
Volume Momentum
20-session average of daily KSE-100 log returns, weighted by each session's liquid-stock turnover estimate.
Safe Haven Demand
Blended gold-in-PKR and USD/PKR two-week returns minus the KSE-100 return, inverted.
Derivatives Activity
Futures volume as a share of ready-market volume, plus open interest as a share of free float.
Foreign Flows
20-session net foreign value divided by liquid-stock turnover estimates. Requires 20 complete rolling observations; initial weight 0.25.
Turnover is estimated as close × volume across eligible liquid stocks, not exchange-wide actual traded value. Futures activity is a risk-appetite proxy and does not identify net bullish positioning. Sources: PSX official market data, PSX futures and open interest, gold priced in PKR, USD/PKR, and foreign portfolio investment flows.
FAQ
Investify's PSX Fear & Greed Index is a daily snapshot of market sentiment in Pakistan. It brings several market signals together into a score from 0 to 100: lower readings indicate fear and higher readings indicate greed.
Fear means the combined signals are weak, Greed means they are strong, and Neutral is the middle band. Below 30 is Extreme Fear; 30 to below 45 is Fear; 45 to below 55 is Neutral; 55 to below 70 is Greed; and 70 or above is Extreme Greed. These labels describe sentiment, not the chance of making a profit.
The KSE-100 tracks the performance of its constituent shares. The Fear & Greed Index interprets market conditions using price trends, participation, volatility and other signals. Its points are sentiment scores, not index levels or percentage returns.
It considers KSE-100 momentum, volatility, market breadth, price strength, volume momentum, safe haven demand, derivatives activity and foreign flows. Each signal is compared with its own history, and eligible signals are combined into the overall score. The cards show which signals are currently included.
Foreign flows, or FIPI, record net buying or selling by foreign investors. They add a view of foreign participation alongside local price and trading activity. The index compares net foreign flows with estimated liquid-stock turnover; foreign buying alone does not guarantee rising prices.
The index is calculated nightly after market close, rather than changing with every trade. Check the date next to the score for the latest available session. A weekend, holiday or processing delay can leave the previous reading on screen.
Start with the score and trading date, compare the reference readings, then use the chart to see whether sentiment has strengthened or weakened. Check the component cards for disagreement. Use that context alongside company announcements and financial research, not as a standalone trading rule.
Not necessarily. Weak sentiment is different from low valuation. A stock's price still needs to be assessed against its earnings, assets, prospects and risks. Extreme Fear is not an automatic buy signal, and Extreme Greed is not an automatic sell signal.
It describes current and recent market conditions; it does not provide a reliable forecast of the next market move. Strong or weak sentiment can persist, and company-specific developments can matter more for an individual stock.
Yes. You can view Investify's latest available score, history chart and signal breakdown without creating an account.
PSX guides
The index tells you what sentiment is doing. These guides explain why the PSX moves and how to act on it.
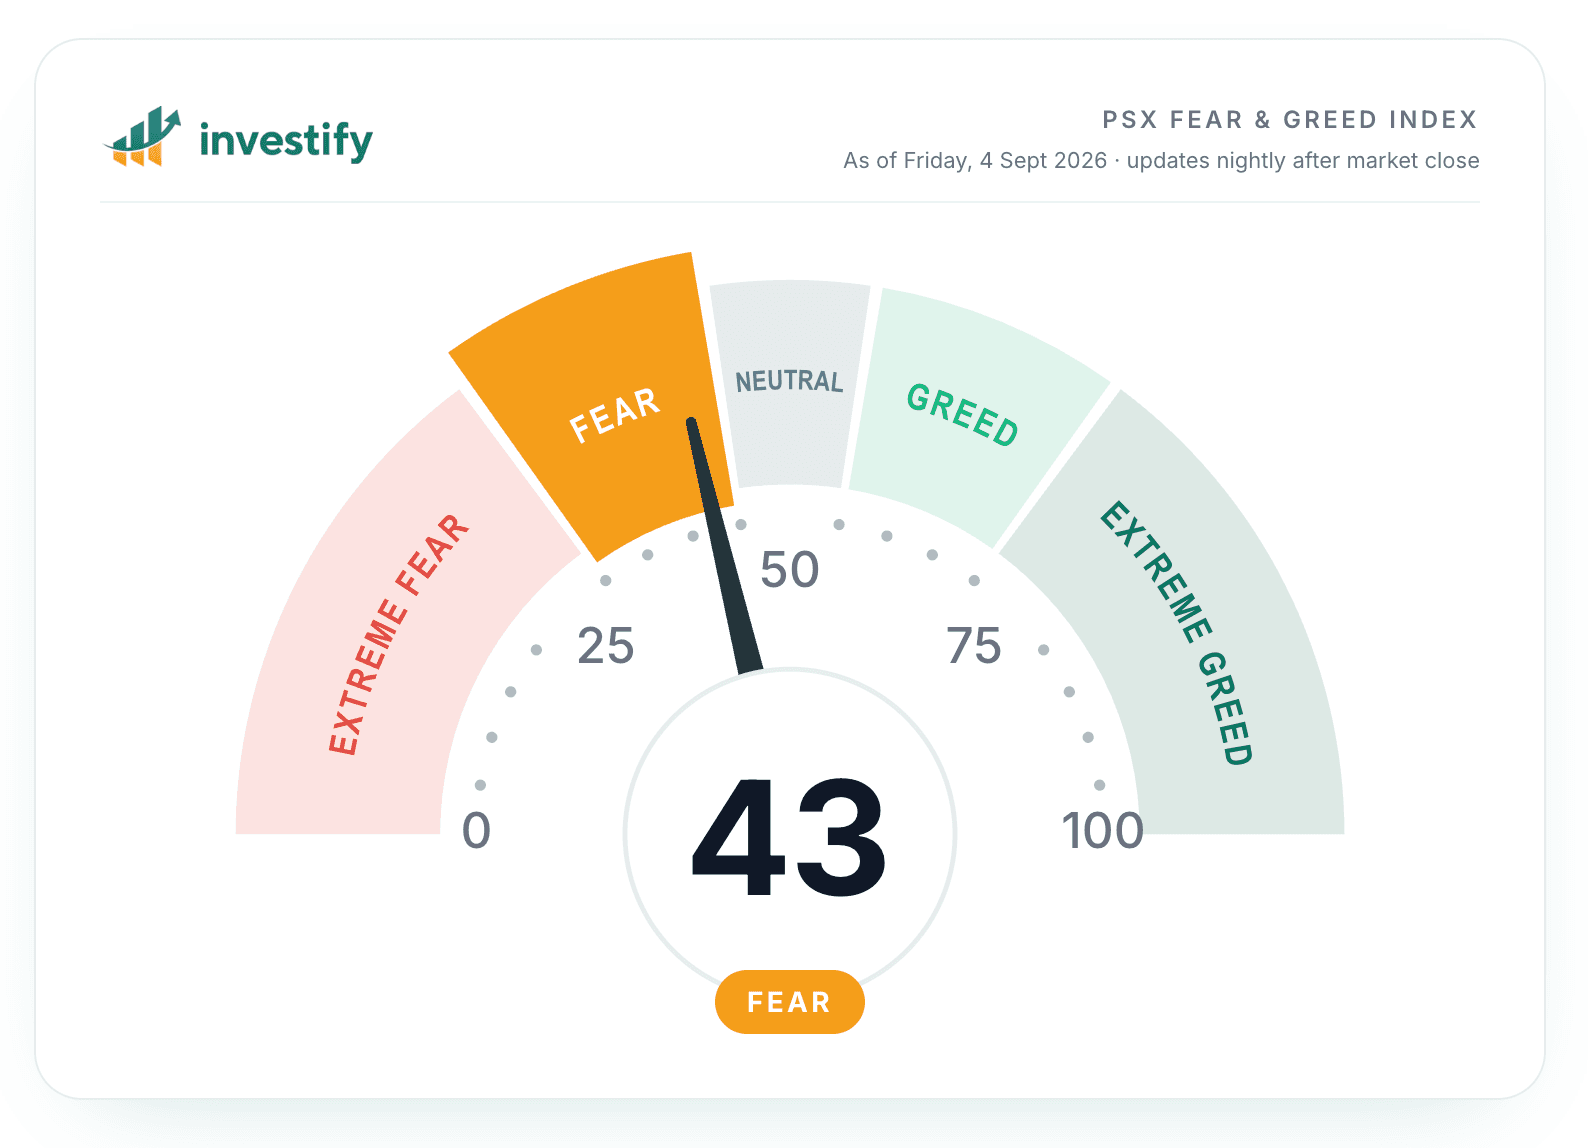
Understand Investify's PSX Fear & Greed Index: its eight signals, FIPI foreign flows, weighted calculation, daily updates and one-year sentiment chart.
Read guide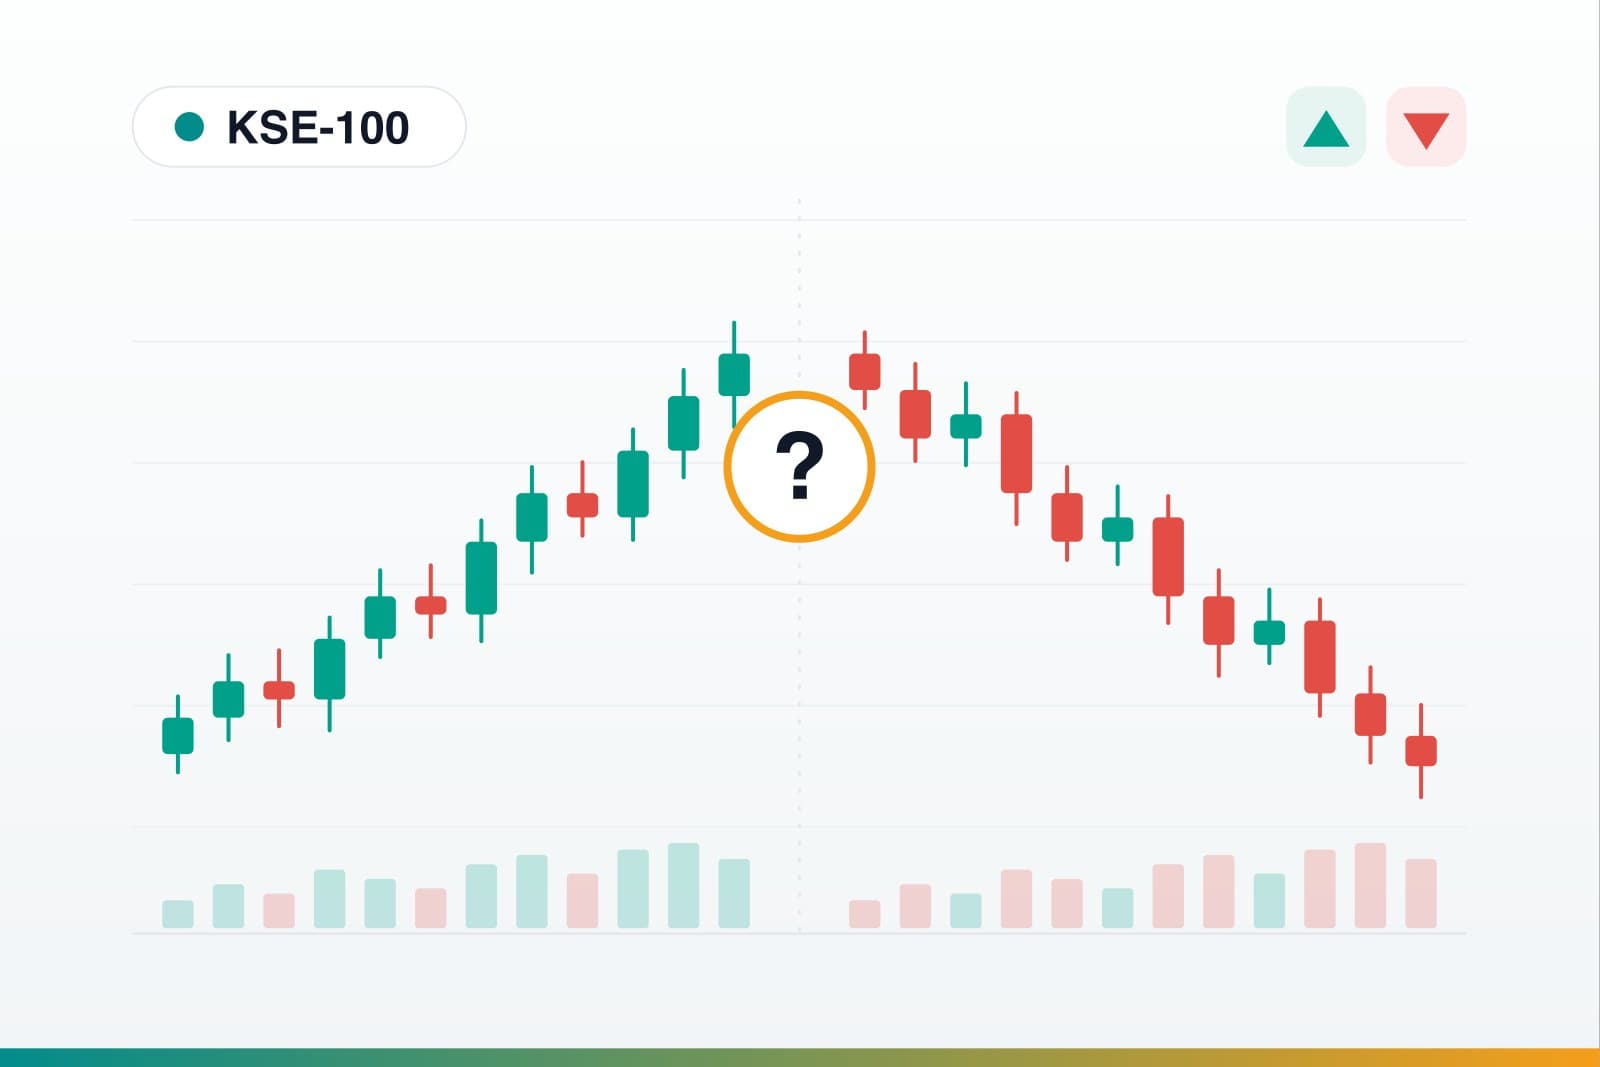
A live look at the KSE-100 plus the seven forces that actually move the Pakistan Stock Exchange - interest rates, the rupee, politics, global shocks, results, flows and market mechanics.
Read guide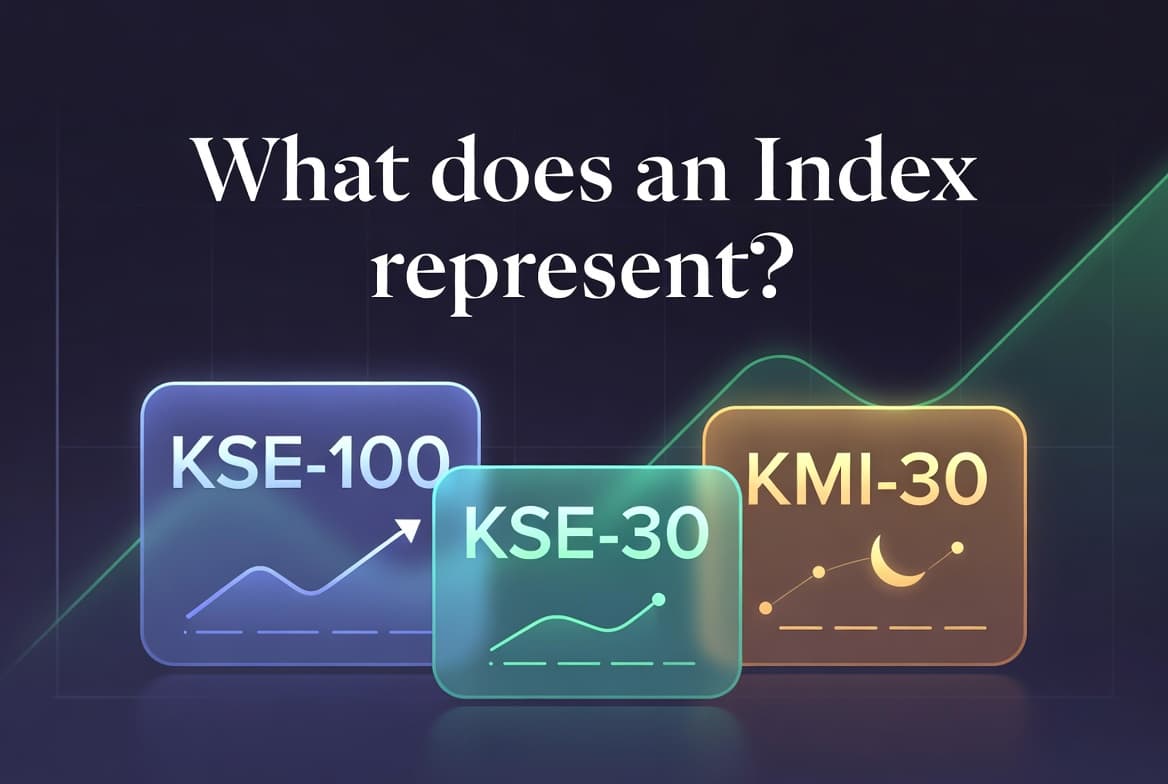
Learn what KSE100, KSE30, KMI30 and other Pakistan Stock Exchange indices mean, how they differ, and how beginners can use them to understand PSX market movement.
Read guide