


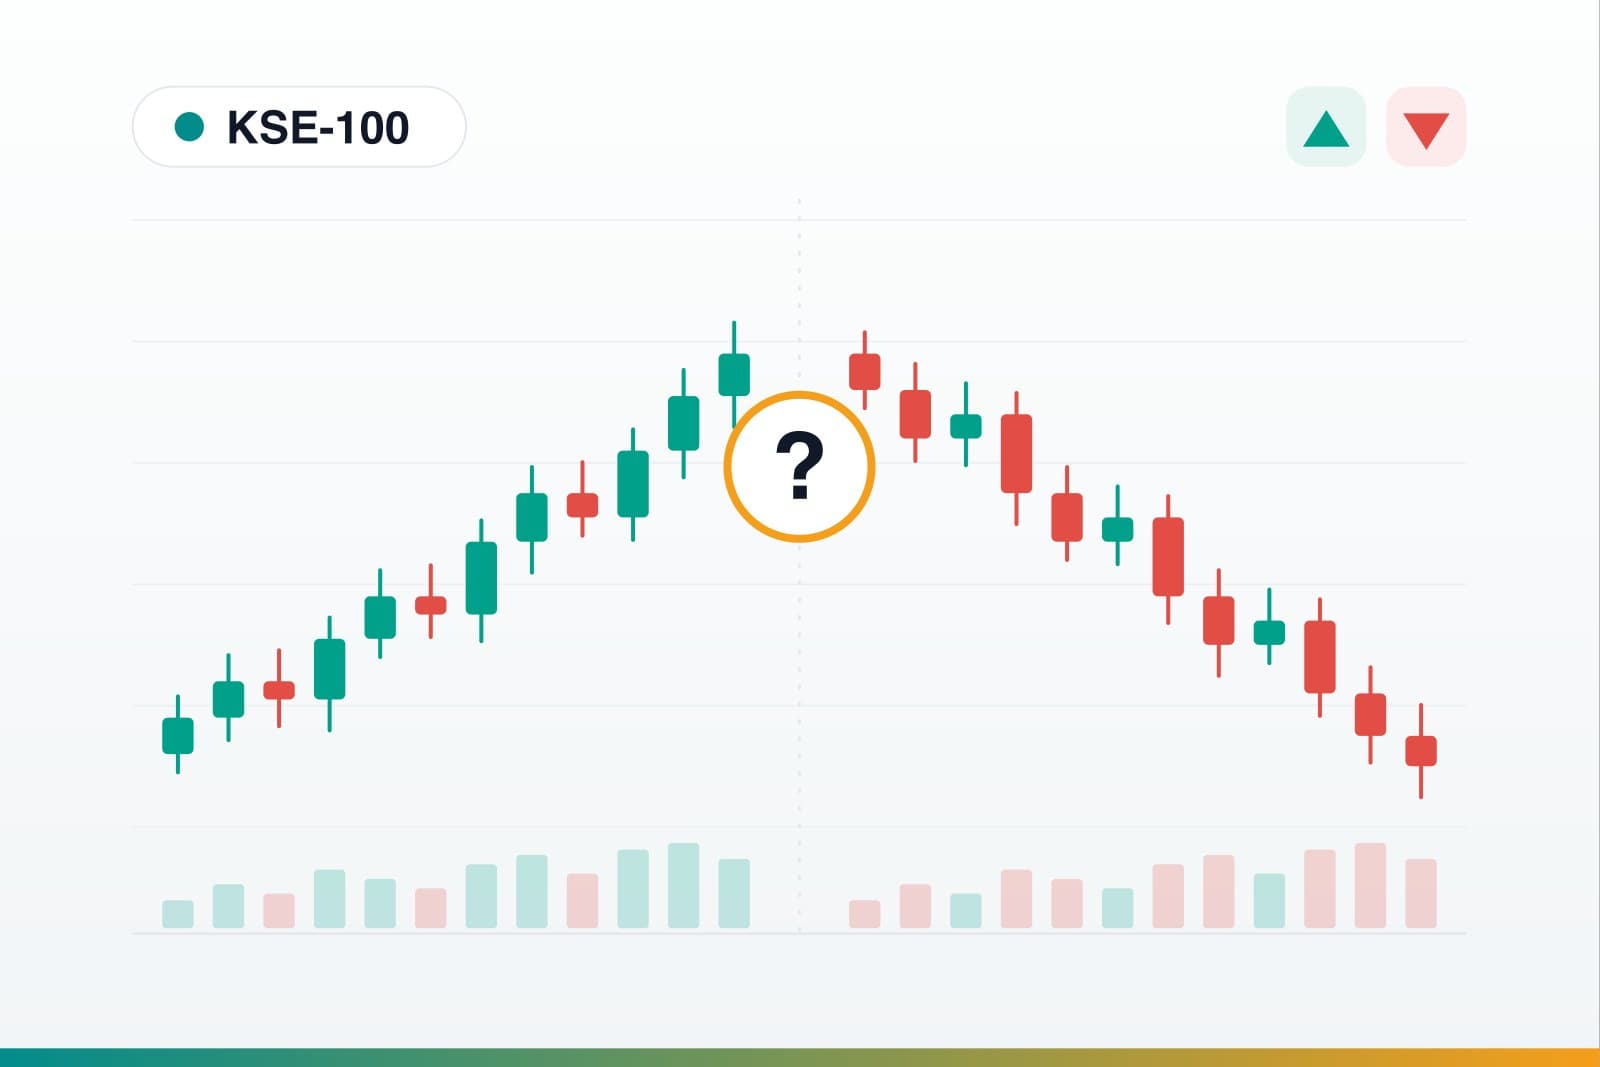
Why Is the PSX Up or Down Today?
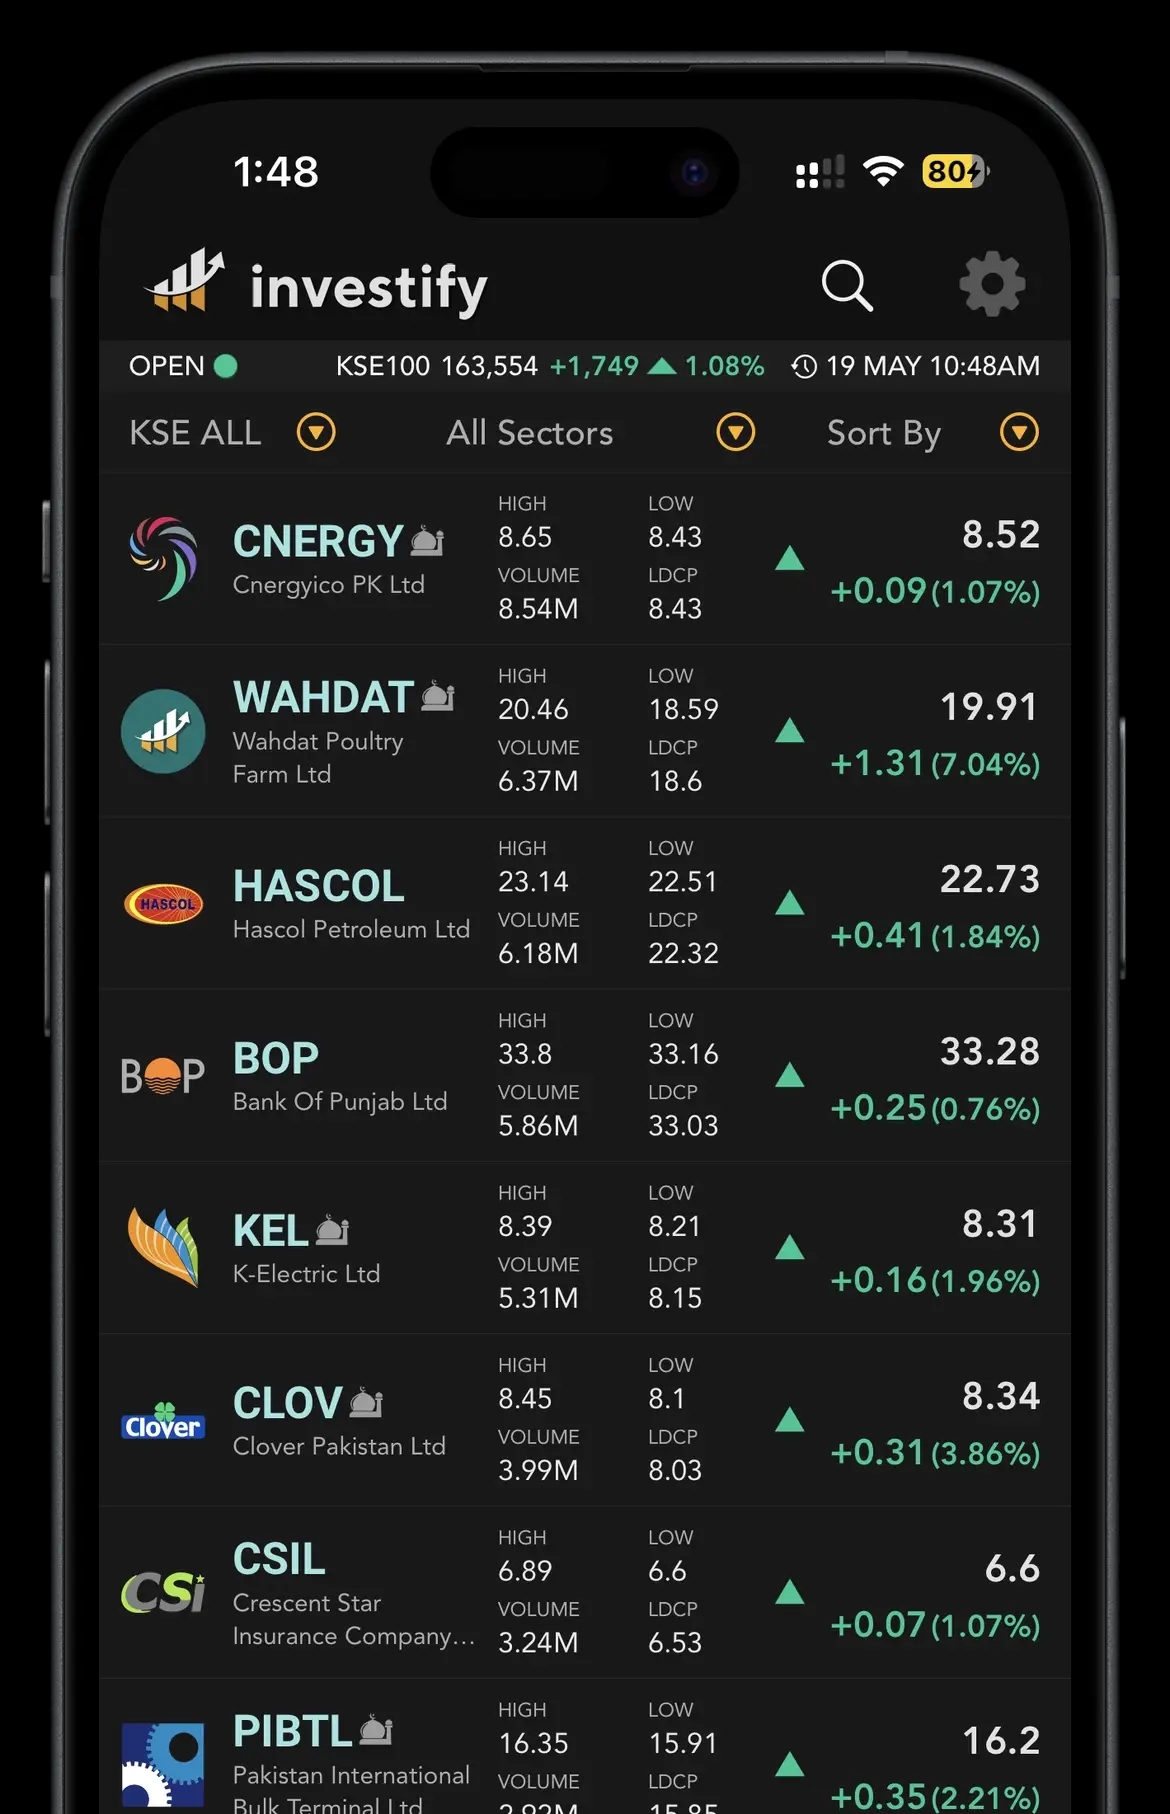
Every trading day, thousands of people search some version of the same question: why is the PSX falling today, or why is the market suddenly flying? News articles answer it for one specific day and then go stale. This page takes the other approach: it shows you the market live, then explains the small set of forces that drive almost every up day and every down day on the Pakistan Stock Exchange - so you can diagnose today's move yourself, today and every day after.
KSE-100 right now
Open the live KSE-100 pageKey takeaways
- Almost every daily move in the KSE-100 traces back to seven recurring forces: interest rates, the IMF/rupee/macro picture, politics, global shocks, corporate results, big-money flows, and market mechanics like profit-taking.
- Always convert points to percent before reacting. A 1,000-point headline can be a routine half-percent day at high index levels.
- Broad moves (most sectors together) are usually macro-driven; narrow moves are usually about specific heavyweight companies.
- One red day says almost nothing about a long-term investment plan - behaviour on red days is where beginners lose the most money.
- You can identify the likely cause of any day's move in about 60 seconds using the index page, sector view, gainers/losers and the announcement feed.
Start with the number, not the noise
Before asking why the market moved, establish how much it actually moved:
- Convert points to percent. Divide the change by the index level. Headlines quote points because they sound dramatic; percent tells you the truth. A fall that would have been a crash at an index level of 45,000 is a routine dip at 190,000.
- Check the breadth. If banks, cement, fertiliser and energy are all red together, the cause is macro - rates, currency, politics, the world. If the index is down but most stocks are flat, one or two heavyweight companies are dragging it.
- Check the calendar. Is it a results announcement day for index giants? The day of a monetary policy meeting? A budget week? Rollover week for futures? Scheduled events explain a surprising share of "sudden" moves.
As a rough scale for daily KSE-100 moves: under 1% is ordinary noise, 1-3% is a notable day with a findable cause, and beyond 3% something specific has almost always happened - and it will be in the business press within hours.
The seven forces that move the KSE-100
1. Interest rates and SBP policy
The single most persistent driver of the PSX is the State Bank of Pakistan's policy rate. High rates make risk-free bank deposits and government securities attractive, pulling money out of shares; falling rates push savers toward equities and cut borrowing costs for listed companies. Banks - the heaviest sector in the KSE-100 - are directly geared to the rate cycle. Markets also move on expectations: the index often rallies or slides in the days before a Monetary Policy Committee meeting as investors position for the decision, then moves again if the announcement surprises.
2. The IMF, the rupee and the macro picture
Pakistan's market prices in the country's external health daily: IMF programme reviews and disbursements, foreign-exchange reserves, the rupee-dollar rate, inflation prints and the trade balance. Good news on any of these tends to lift the whole market because it lowers the risk of the crises - devaluation, import restrictions, default fears - that have historically punished PSX investors. Bad news does the reverse, fast. When you see a broad move with no obvious corporate cause, check this category first.
3. Politics and security
Elections, coalition stress, protests, court decisions and security incidents all move the index, because they change the perceived risk of holding Pakistani assets at all. Political-risk moves are often sharp but short-lived: the market frequently recovers once uncertainty resolves, whichever way it resolves. What equities dislike most is not any particular outcome but prolonged not-knowing.
4. Global shocks: oil, trade and world markets
The PSX does not trade in a vacuum. Oil prices feed directly into Pakistan's import bill, inflation and the profits of listed energy companies. Global risk sentiment, US interest rates and international trade policy spill over too. A concrete example: in February 2026, the KSE-100 fell more than 3% in a single session - over 5,400 points - as confusion around new US tariff proposals hit markets worldwide, with losses across nearly every major PSX sector. Nothing had changed inside those Pakistani companies that morning; the shock was entirely imported.
5. Results season, dividends and corporate news
Listed companies report quarterly, and the reporting seasons (roughly February, April, August and October, with annual results around year-ends) reliably produce sharp single-stock moves: beats, misses, surprise dividends, bonus shares. Because the KSE-100 is capitalisation-weighted, results from a handful of giant banks, energy and fertiliser companies can move the whole index while the average stock barely trades. If the index moved but breadth was narrow, open the announcements of the day's biggest movers - the explanation is usually a filing.
6. Big-money flows: foreign and institutional investors
Mutual funds, banks, insurance companies and foreign investors trade in sizes that move prices. NCCPL publishes daily foreign investor (FIPI) and local investor category flows, and sustained foreign buying or selling often marks the difference between a rally that keeps going and one that stalls. Individual investors sometimes read a falling market as "everyone knows something" when it is often one large institution rebalancing.
7. Market mechanics: profit-taking, leverage and index events
Finally, markets move for internal reasons that have nothing to do with news: profit-taking after a strong run, margin calls that force leveraged traders to sell into weakness (which is how ordinary dips occasionally snowball into 1,000-point headlines), futures rollover weeks, and index rebalancing when companies enter or leave the KSE-100. In April 2026, for instance, the index dropped more than 1,000 points in a midday session on broad selling pressure with decliners far outnumbering gainers - the kind of day that reads as dramatic but is often positioning, not fundamentals.
Noise or trend? How to tell the difference
A single red or green day is weather. A trend is climate. Three questions separate them:
- Is there follow-through? One 2% drop that recovers within a week is noise. Repeated drops on rising volume over weeks, with rallies that keep failing, is a trend worth understanding.
- Did the macro story change? A tariff headline scares markets for days; a collapsed IMF review changes the investment case for months. Ask whether the reason is temporary or structural.
- Are your companies still the same? If the businesses you own are reporting the earnings and paying the dividends you bought them for, a falling index is a price change, not a verdict. If results are deteriorating, the red days are telling you something.
For the chart-reading side of this - trends, support, volume - see our guide to reading PSX stock charts.
When the market is at a record high
The mirror-image search is just as common: the index sets a record, and everyone asks whether it is too late to invest. Two things are worth understanding. First, record highs are normal in a rising market - an index that compounds must spend a lot of time near its all-time high, and Pakistan's FY2026 was a reminder, with the KSE-100 closing the year up around 44% at record levels. Second, "the index is high" and "shares are expensive" are different claims: valuations depend on earnings, not on the index number. A market can be cheaper at 190,000 than it was at 45,000 if profits grew faster than prices.
None of that means prices cannot fall from a record - they can, and sometimes do. It means the index level alone is not an argument in either direction. Investors who are worried about timing often spread their buying over months rather than investing everything at once; whether that fits you depends on your own situation, not on today's index print.
What not to do on a red day
Red days are where beginner portfolios get damaged - usually not by the market, but by the reaction to it. The classic errors:
- Panic-selling the dip, converting a temporary price fall into a permanent loss.
- Revenge-buying the bounce, chasing whatever rose most yesterday.
- Checking prices every ten minutes, which makes every wiggle feel like an emergency.
- Averaging down blindly into a company whose actual business is deteriorating, just because the price is lower.
We cover these patterns - and how to build rules that prevent them - in common mistakes beginners make in PSX.
How to find today's reason in 60 seconds
A repeatable diagnosis routine, in order:
- Open the KSE-100 live page - size of the move in percent, day range, volume. (Here it is.)
- Check breadth - are most sectors and heavyweights moving together, or is it one or two names?
- Scan gainers and losers - the losers list on a red day tells you which sector is being sold.
- Read the news and announcements feed - rate decisions, macro prints and company filings will be at the top.
Investify puts all four on adjacent screens - the index pages with live levels and constituents, the gainers/losers views, business news and the company announcements feed - which is exactly how this article's live snapshot above stays current.
Use Investify for your daily PSX workflow
Open market data, stock pages, charts, news, announcements, watchlists and portfolio tracking from one Investify account.
Watch the PSX live with InvestifyEducational note
This article is for general education only. It is not investment advice, it does not predict market direction, and it does not recommend buying or selling any security or acting on any single day's market move. Market drivers, index levels, interest rates and regulations change constantly; the historical episodes mentioned are illustrations, not patterns guaranteed to repeat. Live figures shown on this page come from market data feeds and can be delayed or revised. Make investment decisions based on your own circumstances, and consult a qualified adviser where needed.
The bottom line
The PSX is up or down today for a reason, and it is almost always one of seven: interest rates, the macro/IMF picture, politics, a global shock, corporate results, institutional flows, or market mechanics. Convert the move to percent, check whether it is broad or narrow, scan the day's headlines and filings, and you will usually have your answer in a minute - the live snapshot at the top of this page is your starting point, every day. What separates investors who compound from investors who churn is not predicting these moves; it is refusing to let a single day's move rewrite a plan built on longer reasoning.
Related reading
Sources and references
- PSX Data Portal - live indices and market data
- State Bank of Pakistan - Monetary Policy decisions
- NCCPL - market information and investor-category flows (FIPI/LIPI)
- Profit - KSE-100 tumbles over 3% as selling pressure grips PSX (Feb 2026)
- Pakistan Today - KSE-100 falls more than 1,000 points in midday trade (Apr 2026)
- Business Recorder - Pakistan stocks end FY26 on a high as KSE-100 jumps 44%