


How to Read a PSX Stock Quote: Price, Volume, Bid, Ask and Day Range
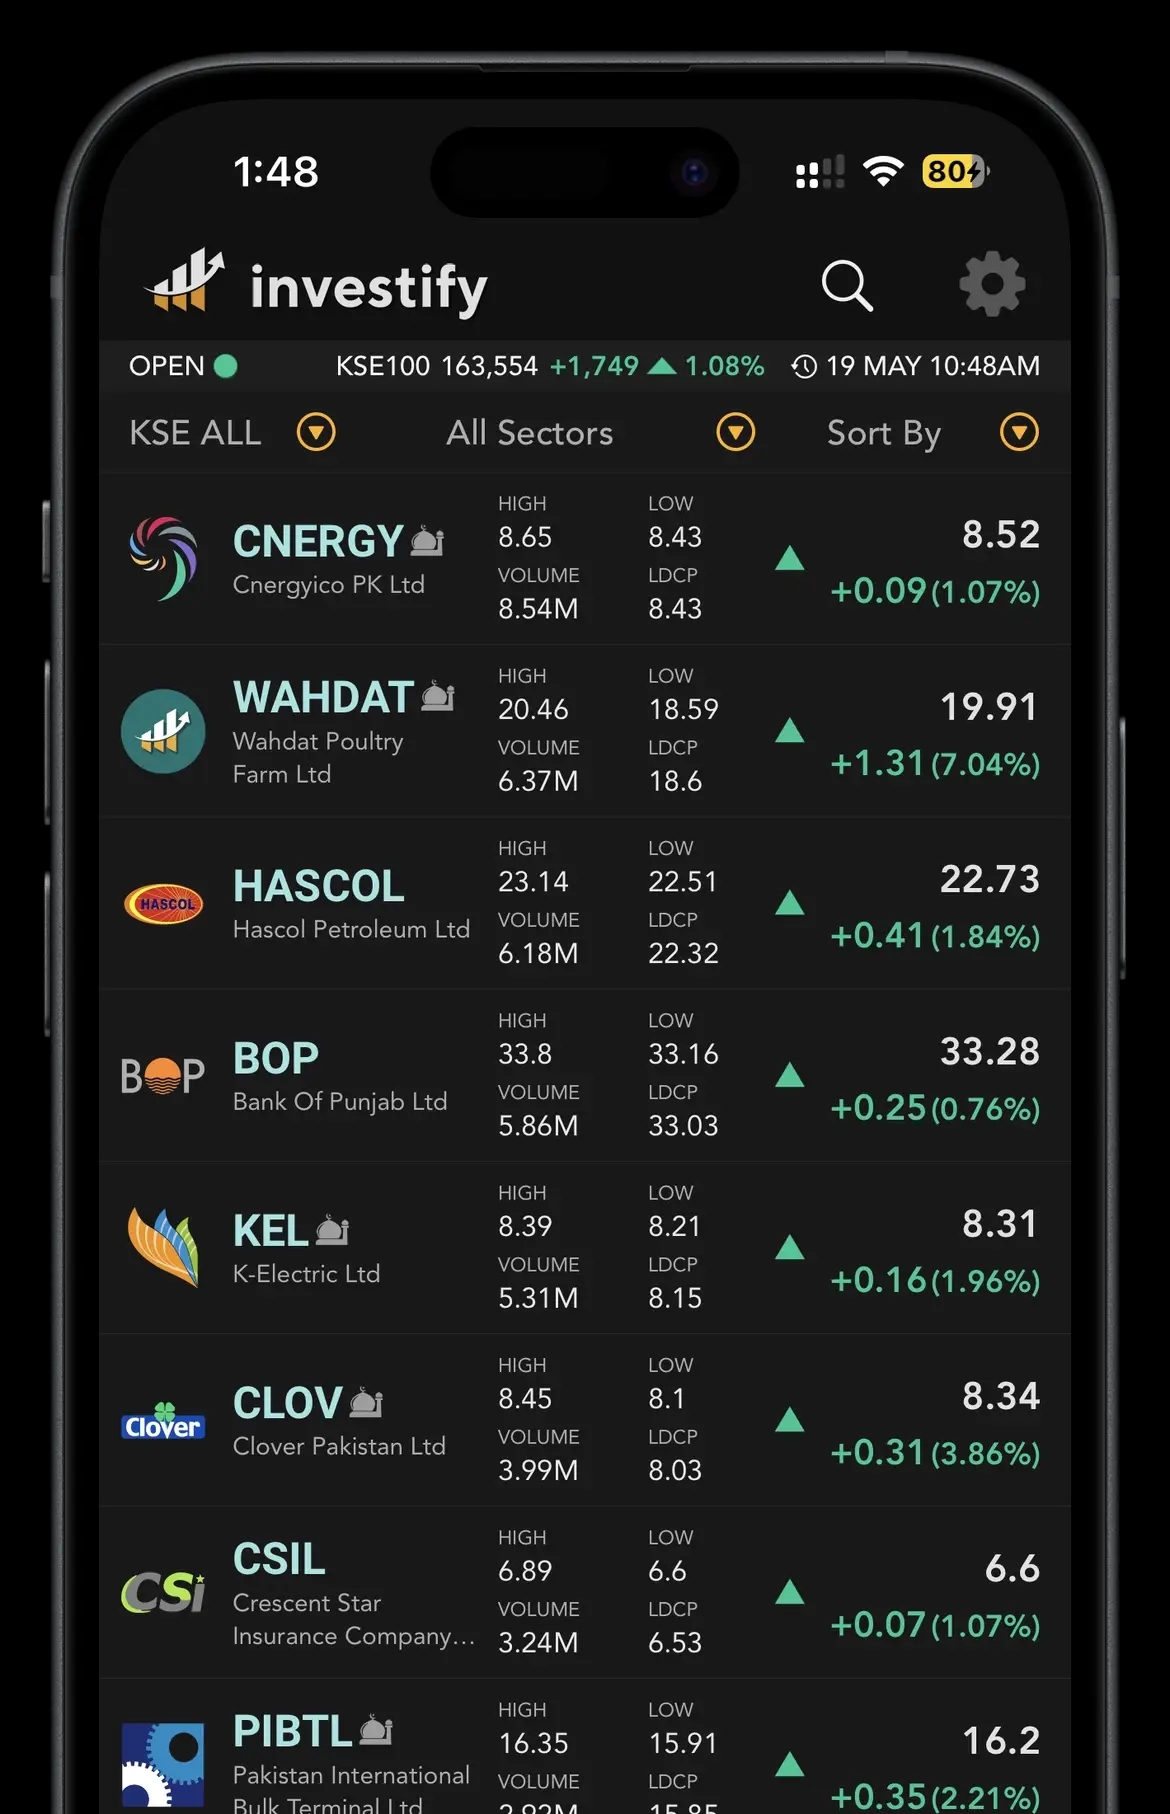
The first time you open a stock quote on the Pakistan Stock Exchange, it can look like a cockpit dashboard: numbers, arrows, green and red figures, abbreviations, timestamps and ranges. The reassuring part is that a PSX quote is really just a handful of facts about one share arranged in a standard way. Once you know what each number is answering, the whole panel becomes much easier to read.
This guide takes the dashboard apart, one field at a time. We will use real PSX symbols only as neutral examples to make each field concrete. By the end, you should be able to glance at any quote and understand exactly what it is telling you, and what it is not telling you.
Key takeaways
- A stock quote is a snapshot of facts about one share at a moment in time: latest price, price change, volume, bid, ask and trading ranges.
- The last traded price is just the most recent transaction, not a fixed value or a verdict on the company.
- Volume measures activity, not quality. Bid and ask reveal liquidity and the cost of trading. Day range and 52-week range provide context.
- A quote describes the present and past. It cannot predict the future, and no single quote field tells you whether to buy or sell.
- Prices move during market hours, so always check live or latest available data before acting. Investify helps you read PSX quotes, charts, watchlists and portfolio data, but it is not a broker.
What is a PSX stock quote?
Think of a stock quote as a share's vital signs. It does not tell you everything about the company, but it gives you a fast, standardised read on what is happening right now. A PSX quote bundles the key market numbers for a listed company, such as price, change, volume, bid, ask and trading ranges, into one view.
Two things are worth fixing in your mind from the start. First, a quote is descriptive, not prescriptive. It reports what the market is doing; it does not tell you what you should do. Second, the headline number, the price, is the result of buyers and sellers meeting in the market. It is not an official valuation stamped by the exchange.
The main parts of a stock quote
Let's walk through the fields you will usually see on a quote screen.
Symbol and company name
Every listed company trades under a short ticker symbol. Oil & Gas Development Company trades as OGDC, Habib Bank as HBL, Lucky Cement as LUCK, and Meezan Bank as MEBL. The symbol is what you search for and what appears on market screens and confirmations.
A quick caution: symbols can look alike, and a company's symbol is not always an obvious abbreviation of its name. Always confirm you are looking at the right share by checking the full company name next to the symbol.
Last traded price
This is usually the large number near the top: the price at which the most recent trade actually happened. If LUCK shows PKR 1,045, it means the last time shares changed hands, the agreed price was PKR 1,045.
The key word is last. During trading hours, this figure can update whenever a new trade goes through. When the market is closed, it holds the final or latest available price from the previous session. It is a record of what just happened, not a promise about what will happen next.
Price change and percentage change
Right beside the price you will usually see a rupee change and a percentage change, often colour-coded. These are normally measured against the previous close.
Say a share closed yesterday at PKR 100 and is trading at PKR 103 now. The change is +PKR 3, or +3.00%. Green typically means up compared with the previous close; red typically means down. The percentage change is useful because it lets you compare movement across stocks with different price levels. A PKR 3 move is very different for a PKR 30 share than for a PKR 1,000 share.
Volume
Volume is how many shares have traded. For an intraday quote, that means the number of shares exchanged so far today. If OGDC shows a volume of 4,200,000, then 4.2 million OGDC shares have changed hands in the session.
A useful analogy: volume is like footfall in a bazaar. A stall with constant foot traffic is easier to buy from and sell to because there is usually someone on the other side of the deal. A quiet stall might still have good products, but you may wait longer or accept a worse price. High volume often means better liquidity, but it does not mean the company is good.
Bid price and ask price
The bid and ask sit closer to the order-book side of the quote.
- The bid is the highest price a buyer is currently willing to pay.
- The ask, also called the offer, is the lowest price a seller is currently willing to accept.
Picture a property deal. The buyer says, "I will pay 95 lakh." The seller says, "I want 98 lakh." Nothing happens until one side moves to meet the other. Shares work the same way, just faster and in smaller increments. A trade executes when a buyer agrees to pay the ask, or a seller agrees to accept the bid.
Bid volume, ask volume and spread
Next to bid and ask, you may see quantities: how many shares buyers want at the bid, and how many sellers are offering at the ask. These show immediate demand and supply at that moment, but they can change quickly.
The gap between the bid and the ask is the spread. If the bid is PKR 99.50 and the ask is PKR 100.00, the spread is 50 paisa. The spread is effectively the cost of immediacy: the difference between buying right now at the ask and selling right now at the bid.
Liquid, heavily traded shares tend to have tight spreads. Thinly traded shares often have wider spreads. A wide spread is a quiet warning that entering and exiting the share may cost more than commission alone.
Use Investify for your daily PSX workflow
Open market data, stock pages, charts, news, announcements, watchlists and portfolio tracking from one Investify account.
Search PSX stocksOpen, previous close and last traded time
A few supporting fields give the headline price its context:
- Open is the price at which the share first traded when the session began. PSX publishes official trading-hours details, including pre-open and open sessions, and those timings can vary by market/session.
- Previous close is the final price from the last trading session. This is the baseline for the usual rupee and percentage change.
- Last traded time is the timestamp of the most recent trade. If the market is open but the timestamp is old, the share may not have traded recently, which can be a sign of low activity.
Day range: day low and day high
The day range is the lowest and highest price the share has touched during the current session. If a share shows a day low of PKR 98 and a day high of PKR 104, you know it has traded within a six-rupee band today, and you can see where the latest price sits inside that band.
Think of it as the day's temperature range. A narrow range suggests a calmer session. A wide range suggests more volatility. Neither is good or bad by itself; it simply tells you how much the price has moved during the day.
52-week range
The 52-week range shows the lowest and highest price over the past year. This gives longer-term context. If a share is trading near its 52-week high, it has moved toward the upper end of its one-year band. If it is near its 52-week low, it has been under pressure relative to the year.
Resist the temptation to read fortune into it. Near the high does not mean it will keep rising, and near the low does not automatically mean bargain. It is where the price has been, not where it must go.
Circuit breaker, upper cap and lower cap
PSX applies daily price limits for listed securities through circuit breakers or upper/lower caps. These help limit extreme one-day price moves and give the market time to absorb major news or volatility. The exact cap logic can depend on PSX rules and the security type, so use the official PSX Data Portal or PSX regulations for the current limits.
On quote screens, the upper cap shows the highest price the share is allowed to trade at for that session, and the lower cap shows the lowest allowed price. If a share reaches the upper cap, it cannot trade higher for that session under the current cap. If it reaches the lower cap, it cannot trade lower for that session.
How to read a quote without overreacting
A quote is a snapshot, and snapshots are easy to misread. Three habits keep you grounded.
First, separate price from value. Price is what the share last traded at. Value is what the underlying business is worth, which requires reading financials, earnings, debt, cash flows, announcements and prospects. A PKR 30 share is not automatically cheaper than a PKR 3,000 share.
Second, remember that the quote is live or latest available. During market hours, every figure can change. If you are looking at delayed or after-hours data, treat the numbers as the latest available, not necessarily the current market.
Third, do not let a single field do all your thinking. Not a green arrow, not high volume, not a 52-week high. Each field describes something that already happened or is currently queued in the market. None of them predicts the future alone.
Example: reading a quote step by step
Let's decode a hypothetical quote for HBL the way you might read it in real life:
- Last price: PKR 142.50, change +PKR 2.50 (+1.79%)
- Previous close: PKR 140.00
- Open: PKR 140.80
- Day range: PKR 140.10 to PKR 143.20
- Volume: 3,150,000
- Bid: PKR 142.40 for 12,000 shares
- Ask: PKR 142.50 for 8,500 shares
- 52-week range: PKR 95.00 to PKR 158.00
Read it as a story. The share is up about 1.8% from yesterday's close, so it is having a positive day so far. It opened slightly above the previous close and has traded in a fairly tight three-rupee band, suggesting a relatively steady session. Volume of 3.15 million suggests active trading. The spread is 10 paisa, which is tight in this example. Against the 52-week range, PKR 142.50 sits in the upper portion of the one-year band.
Notice what we did not conclude: we did not say HBL is a buy, a sell, cheap or expensive. We simply translated the quote into plain English. That is the right use of a quote.
How Investify helps you read PSX quotes
Reading one quote is easy. Tracking many shares, with charts and history, is where a good workflow helps. On Investify you can:
- Open stock pages for PSX symbols and see quote fields such as price, change, volume, bid/ask, day range and 52-week range.
- View charts to see how today's price fits into recent days, weeks and months.
- Build watchlists so the shares you follow are easy to monitor.
- Track your portfolio to see how your holdings are doing together.
- Follow news and company announcements that often explain why a quote is moving.
One boundary matters: Investify is a PSX data and portfolio-workflow app, not a broker. It is where you read and research. Actual buying and selling happens through your licensed broker's platform.
Common mistakes beginners make when reading quotes
- Treating the last price as a fixed value. It is the most recent trade, not a permanent price tag.
- Confusing a low share price with cheap. Price per share says nothing by itself about business value.
- Reading high volume as good. Volume is activity, not quality.
- Ignoring the spread on thin stocks. A wide bid/ask gap can quietly cost more than commission.
- Trusting a stale timestamp. If the last traded time is old during market hours, the displayed price may not reflect fresh activity.
- Mistaking an upper cap for a guarantee. A share near a cap is constrained by trading rules; that does not predict what it will do tomorrow.
- Acting on delayed data. Always confirm whether you are seeing live or latest available information.
Educational note
This article is for general education only. It explains what the fields on a Pakistan Stock Exchange quote mean. It is not investment, financial, legal or tax advice, and it does not recommend buying or selling any security. Company symbols such as OGDC, HBL, LUCK, MEBL and MARI are neutral examples only. Market data, trading rules, circuit-breaker levels and session timings can change over time and during the day. Always verify current, live or latest available information from official sources before acting, and consult a qualified professional for personal financial or tax matters. Investify is a PSX market-data and portfolio-tracking app and is not a broker; real orders are placed through your own licensed broker.
The bottom line
A PSX stock quote is not a verdict or a crystal ball. It is a standardised snapshot of one share's facts: what it last traded at, how that compares to the previous close, how actively it is trading, the prices buyers and sellers are offering, and where today sits within the day's and year's range. Learn to read each field for exactly what it says, no more and no less. Use Investify to read quotes, study charts and stock pages, build watchlists and track your portfolio; then place any actual trade through your licensed broker.
Related reading
Sources and references