


PSX Fear & Greed Index by Investify, Explained
The PSX Fear & Greed Index by Investify is a daily measure of Pakistan Stock Exchange sentiment. It combines market trends, participation, volatility, safe-haven demand, futures activity and foreign flows into one score from 0 to 100. Lower readings indicate fear; higher readings indicate greed.
For the latest available score and trading date, open Investify's PSX Fear & Greed Index. This article explains the calculation and how to read it; it is not a live quote page or a trading recommendation.
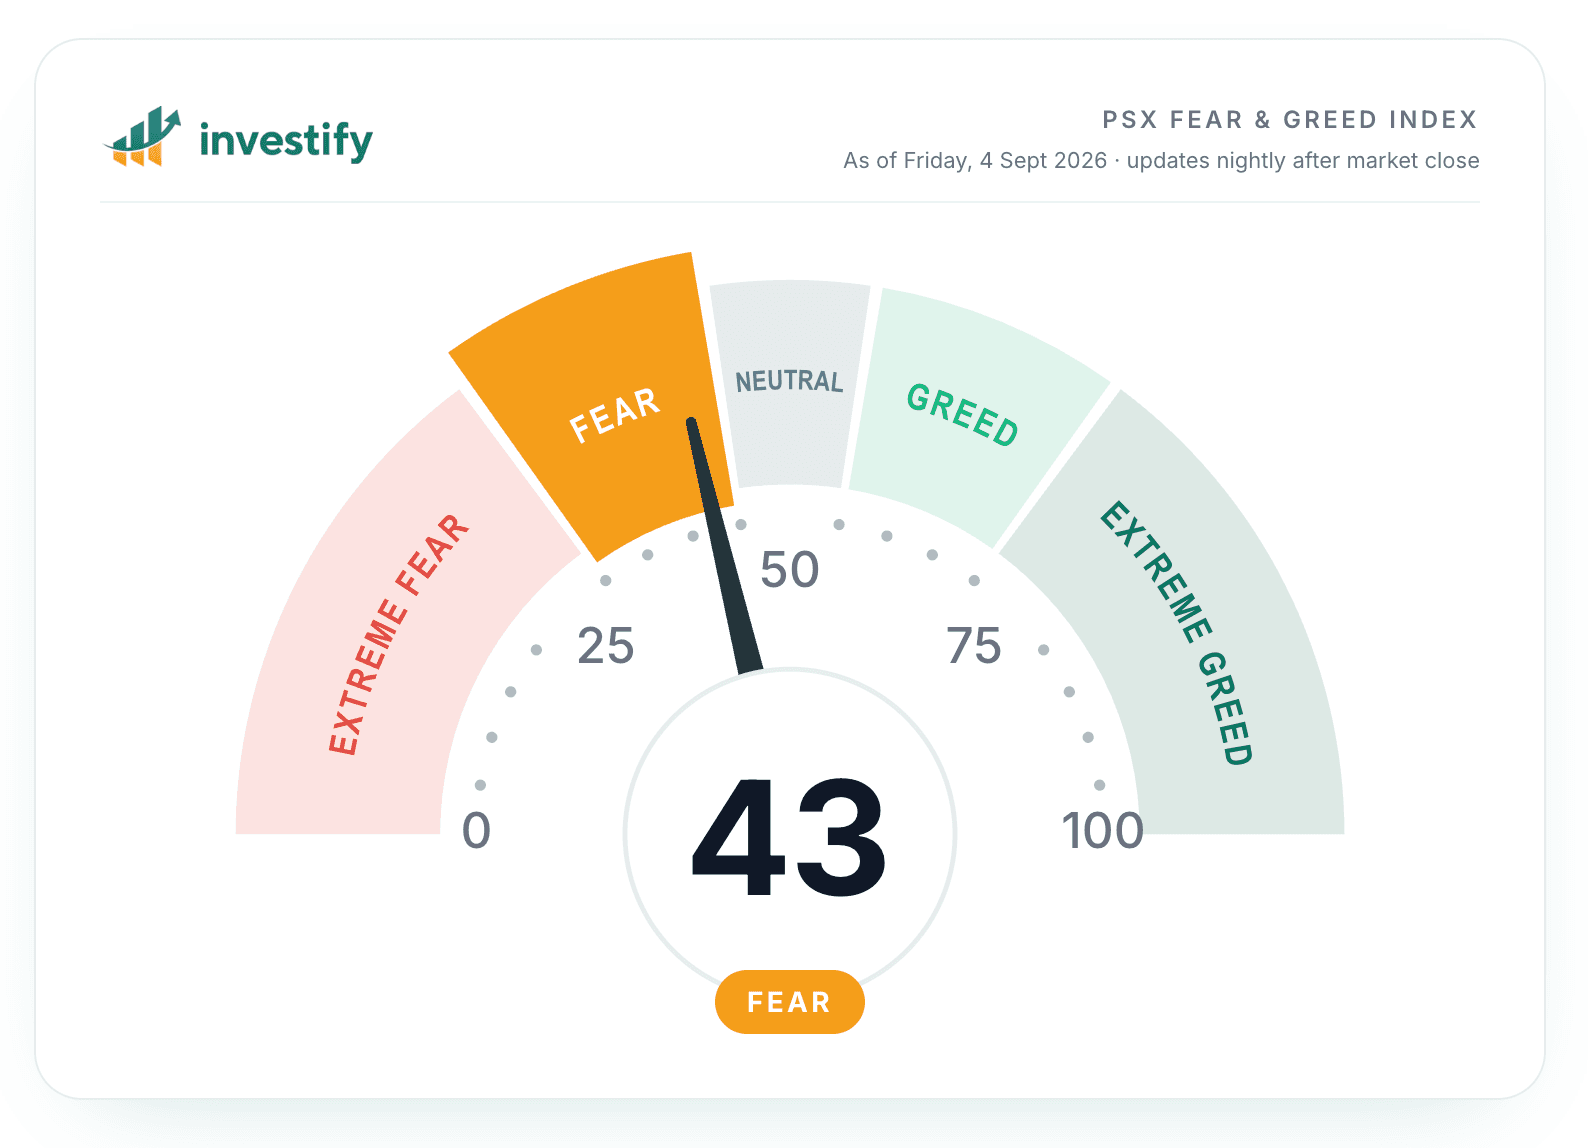
The header screenshot is a dated illustration showing 43 (Fear), not a live reading. The verified v2 worked example below uses the precise score of 43.7.
Key takeaways
- There are eight possible signals, including foreign portfolio flows (FIPI). Availability depends on usable inputs and sufficient history.
- Each component is ranked against up to 500 trading sessions; these are relative scores, not probabilities of a market rise or fall.
- Version 2 uses explicit weights, not an equal average of all eight cards.
- The chart displays approximately one calendar year, but the calculation needs longer input history.
- The index is computed nightly. Missing or stale inputs can exclude a component; they are not treated as zero.
- A sentiment reading is context for research, not an automatic buy or sell instruction.
How to read the five zones
| Score | Zone | Interpretation |
|---|---|---|
| 0 to below 30 | Extreme Fear | Very weak combined sentiment; not proof that prices are cheap |
| 30 to below 45 | Fear | Cautious or weak combined sentiment |
| 45 to below 55 | Neutral | Middle-band sentiment; individual signals may disagree |
| 55 to below 70 | Greed | Strong combined sentiment; not a guarantee that a rally continues |
| 70 to 100 | Extreme Greed | Very strong combined sentiment; not a prediction of a reversal |
The boundary matters: 45 is Neutral, 55 is Greed and 70 is Extreme Greed. A reading of 50 does not mean a 50% chance of a gain. Likewise, a component score near 100 indicates an extreme position within its comparison window, not unanimous investor optimism.
Read the date alongside the number. A Friday reading may remain the latest available score over a weekend. The displayed session date and the time the calculation ran are different concepts.
The eight signals, in plain English
- Momentum. The difference between the KSE-100's 30-session and 90-session exponential moving averages, divided by its 90-session simple moving average:
(EMA30 − EMA90) / SMA90. It compares shorter and longer market trends. - Volatility. Twenty-session realized volatility relative to its 50-session average. The percentile is inverted, so relatively calm conditions receive a higher sentiment score. This is calculated from returns, not an options-based volatility index.
- Market breadth. Over five sessions, advancing-stock turnover minus declining-stock turnover, divided by their combined turnover. This measures the balance of participation across eligible liquid stocks, rather than simply counting whether the headline index rose.
- Price strength. The percentage of eligible stocks near 52-week highs minus the percentage near lows. It helps distinguish broad strength from an index move driven by a narrower group.
- Volume momentum. A turnover-weighted average of daily KSE-100 log returns over 20 sessions. Version 2 replaces the old direction-sign multiplier; shrinking turnover alone no longer flips negative returns into a positive signal.
- Safe haven demand. Ten-session equity performance compared with gold priced in rupees and USD/PKR. Missing or stale macro observations can make this component unavailable.
- Derivatives activity. Percentile scores for futures-to-ready volume and open interest relative to free float. This measures activity, not net bullish positioning: futures can be used for hedging as well as speculation. It is not a put/call ratio.
- Foreign flows (FIPI). Twenty-session cumulative net foreign PKR buying or selling relative to estimated turnover over those exact sessions. Sustained net buying raises the raw measure; net selling lowers it.
Here, turnover is the existing close × volume estimate across the eligible liquid-stock universe, not a claim to represent exact exchange-wide traded value. The universe is filtered for trading history and liquidity. These choices affect what the signals measure.
How the weighted score is calculated
The calculation first converts each eligible raw signal into a percentile score, with fear-oriented measures inverted so that a higher component score consistently points toward greed. Core components require 250 valid observations within a window of at most 500 sessions.
| Component | Relative weight | Share when all eight qualify |
|---|---|---|
| Momentum | 0.5 | 8% |
| Volatility | 1 | 16% |
| Breadth | 1 | 16% |
| Price strength | 0.5 | 8% |
| Volume momentum | 1 | 16% |
| Safe haven demand | 1 | 16% |
| Derivatives activity | 1 | 16% |
| Foreign flows | 0.25 | 4% |
Composite = sum of included component scores × their weights, divided by the sum of included weights. The final result is rounded to one decimal place. At least four core components must qualify; FIPI cannot supply the fourth core signal.
Momentum and price strength share a total weight of 1 to reduce overlapping trend exposure. FIPI has a limited provisional weight because its available history is short. That weight does not automatically grow over time.
When a component is unavailable, the remaining weights are renormalized. Consequently, a daily score can change both because its inputs moved and because the set of available components changed. Version 2 does not apply additional smoothing to the final composite.
Why FIPI does not need 250 daily reports
FIPI needs 20 valid rolling ratios, not merely 20 daily reports. The first ratio requires 20 complete sessions; another 19 sessions normally produce the remaining ratios. With uninterrupted usable flow and turnover inputs, eligibility therefore starts after 39 sessions.
The reviewed dataset contains 48 foreign-flow reports and 29 complete ratios through 4 September 2026. In the historical replay, FIPI first qualifies on 21 August 2026. A missing report is not assumed to mean zero foreign buying or selling.
LIPI is not included as another independent component: aggregate local and foreign net activity describe opposing sides of the same market. Adding both would duplicate that information.
Worked example: 4 September 2026
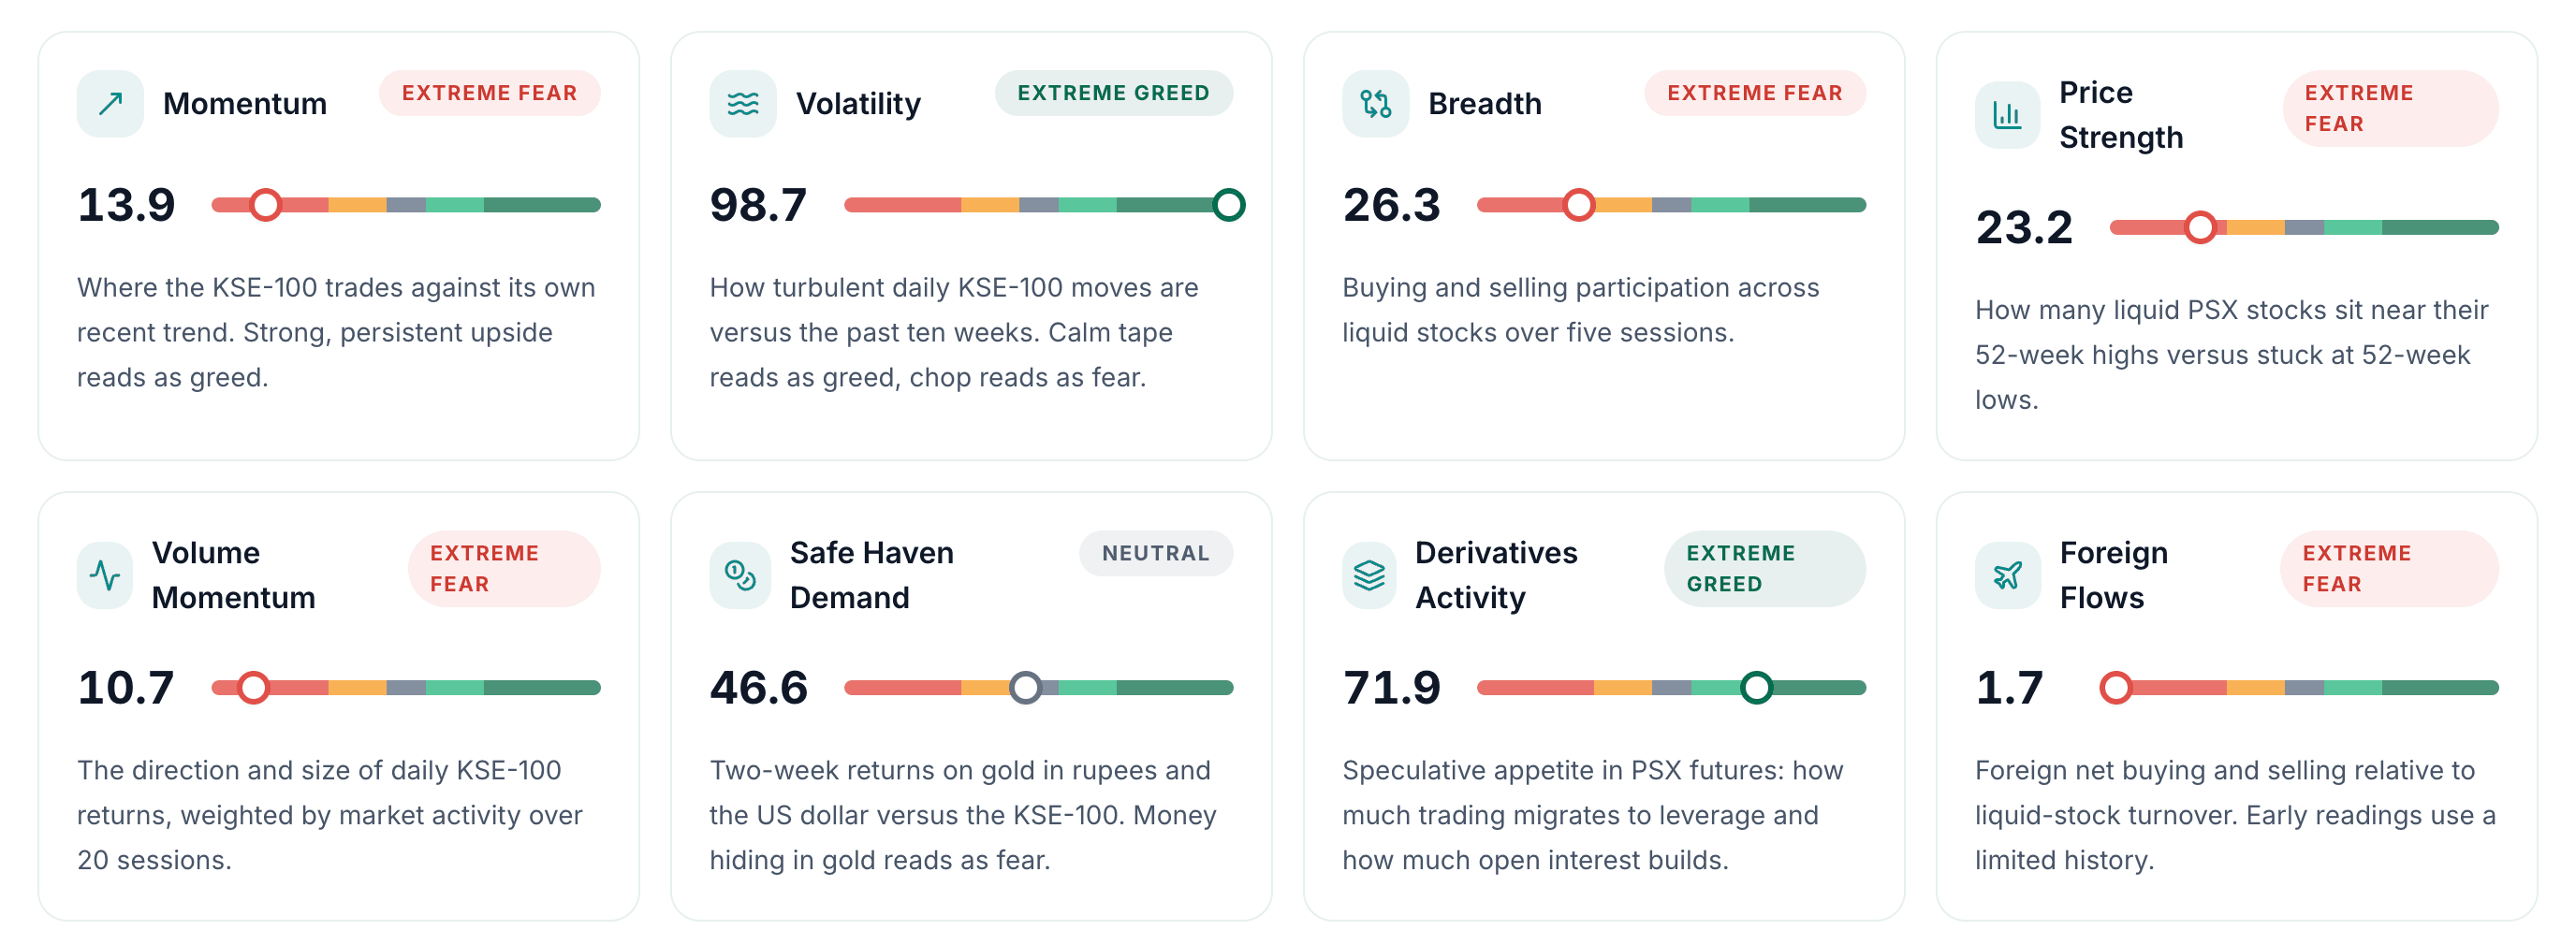
The built v2 reading for this session is 43.7 — Fear. All eight signals qualify:
| Signal | Score | Weight |
|---|---|---|
| Momentum | 13.9 | 0.5 |
| Volatility | 98.7 | 1 |
| Breadth | 26.3 | 1 |
| Price strength | 23.2 | 0.5 |
| Volume momentum | 10.7 | 1 |
| Safe haven demand | 46.6 | 1 |
| Derivatives activity | 71.9 | 1 |
| FIPI | 1.7 | 0.25 |
The weighted total is 273.175, and the included weights sum to 6.25. Dividing gives 43.708, rounded to 43.7.
This is a useful example of disagreement: relatively low volatility scores toward greed, while momentum, breadth, price strength, volume momentum and foreign flows point toward fear. Neither the strongest nor the weakest card tells the whole story.
The same v2 history gives reference scores of 40.4 for the previous session, 36.5 five scored sessions earlier, 33.4 21 scored sessions earlier and 63.7 250 scored sessions earlier. These are trading-session comparisons, not exact calendar anniversaries.
Reading the one-year history chart
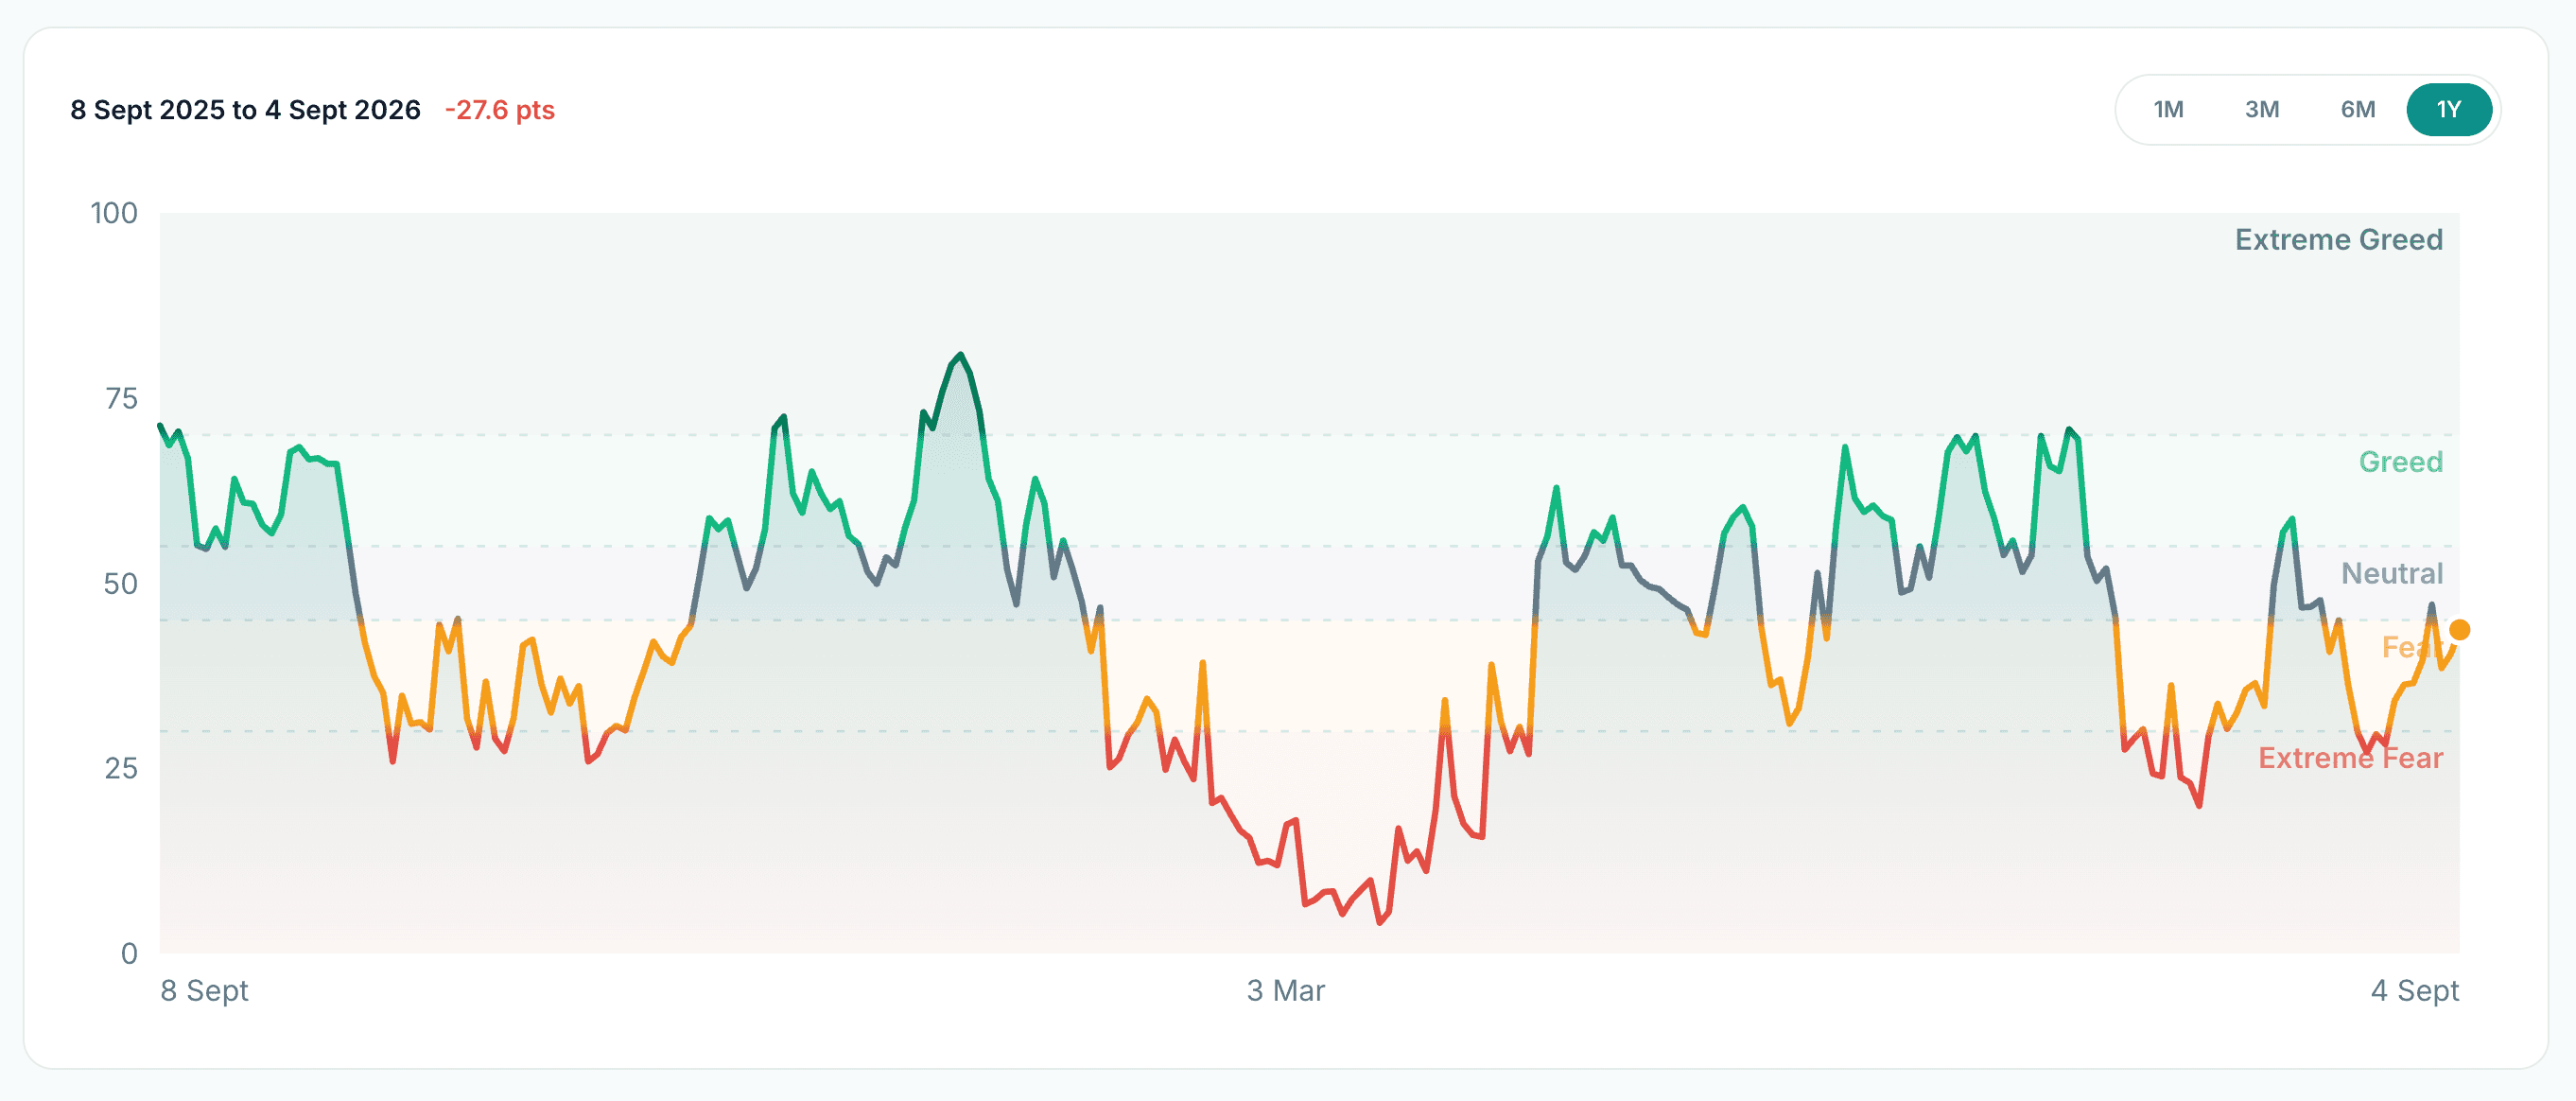
Use the interactive sentiment chart to switch between 1M, 3M, 6M and 1Y views. The year view covers approximately 365 calendar days; the shorter views use trading-session subsets.
The chart range is not the calculation range. Even a single year of displayed scores requires earlier observations to construct raw signals and their percentile windows. Old composite scores are not carried forward as an accumulating input to today's score.
Historical readings under v2 have been recalculated using the same methodology. Do not compare a screenshot from the old version with the revised chart and assume the difference is a new market move. Corrected source inputs can also alter a historical replay.
Large daily changes remain possible. In the reviewed 250-session window ending 4 September 2026, v2's average absolute daily movement was approximately 4.77 points, compared with 5.49 for v1. However, its maximum move was 26.1, versus 23.2 for v1. These descriptive results do not prove predictive ability or guarantee that future readings will be smoother.
Daily updates and missing data
The calculation runs nightly after market close. Publication depends on available inputs and successful processing, so consult the displayed date rather than assuming that a fresh page load means a new session has been scored.
Missing components remain excluded. For example, the current macro-alignment rule rejects observations more than five calendar days old. A fresh currency observation may restore a previously unavailable safe-haven component and change the composite's included weights.
The four-core-signal minimum prevents an overall reading from being published with too little component coverage. It does not certify that every source observation is error-free. Data availability, liquidity filters, revised historical inputs and the short FIPI sample are limitations worth keeping in mind.
How to use it alongside company research
Start with the score and session date, then inspect the individual signals and the chart. A middle-band score can conceal strong disagreement, while an extreme score can persist for several sessions.
Use Investify's company research tools and the guide to researching PSX companies to put sentiment alongside company fundamentals. Check company announcements and relevant business developments before attributing a price move to crowd sentiment alone.
The index does not measure intrinsic value, recommend a position size, or establish when to buy or sell. There is no demonstrated rule here that extreme fear reliably predicts a rebound or that extreme greed predicts a decline.
Educational note
This article explains Investify's methodology and a dated example. It is not investment advice and does not promise returns. The screenshot and worked example refer to 4 September 2026, not necessarily the latest session. Always check the current index page's trading date and methodology notice.
Use Investify for your daily PSX workflow
Open market data, stock pages, charts, news, announcements, watchlists and portfolio tracking from one Investify account.
View the latest PSX Fear & Greed IndexRelated reading
Sources and references