


Beginner-Friendly Financial Ratios for PSX Stocks
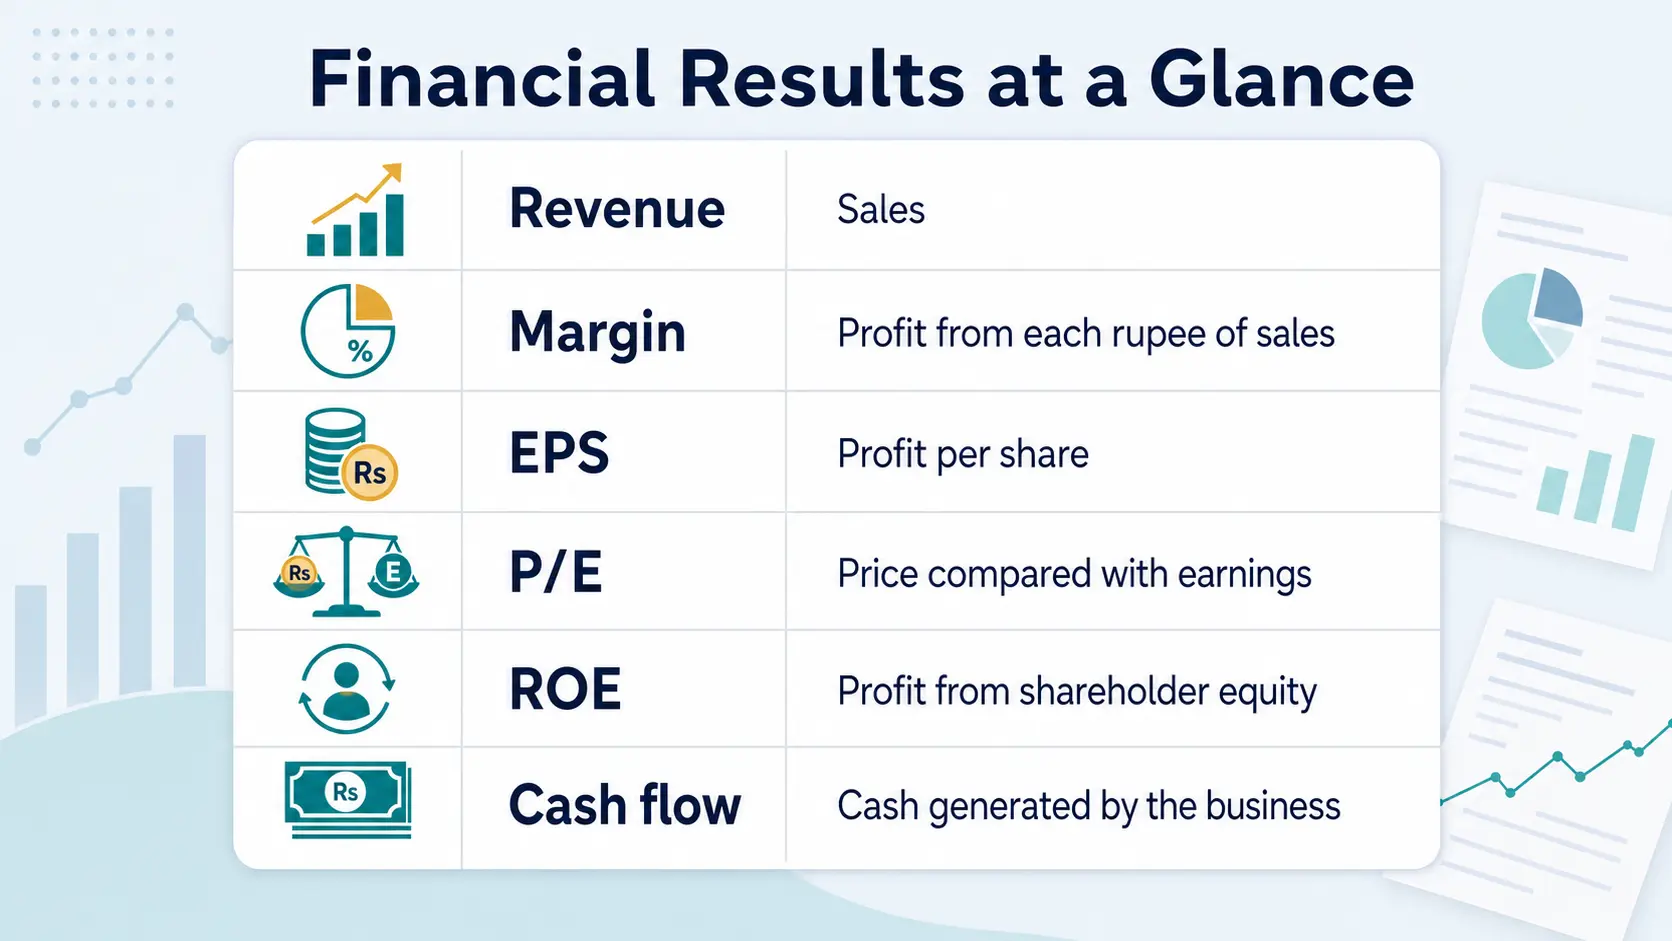
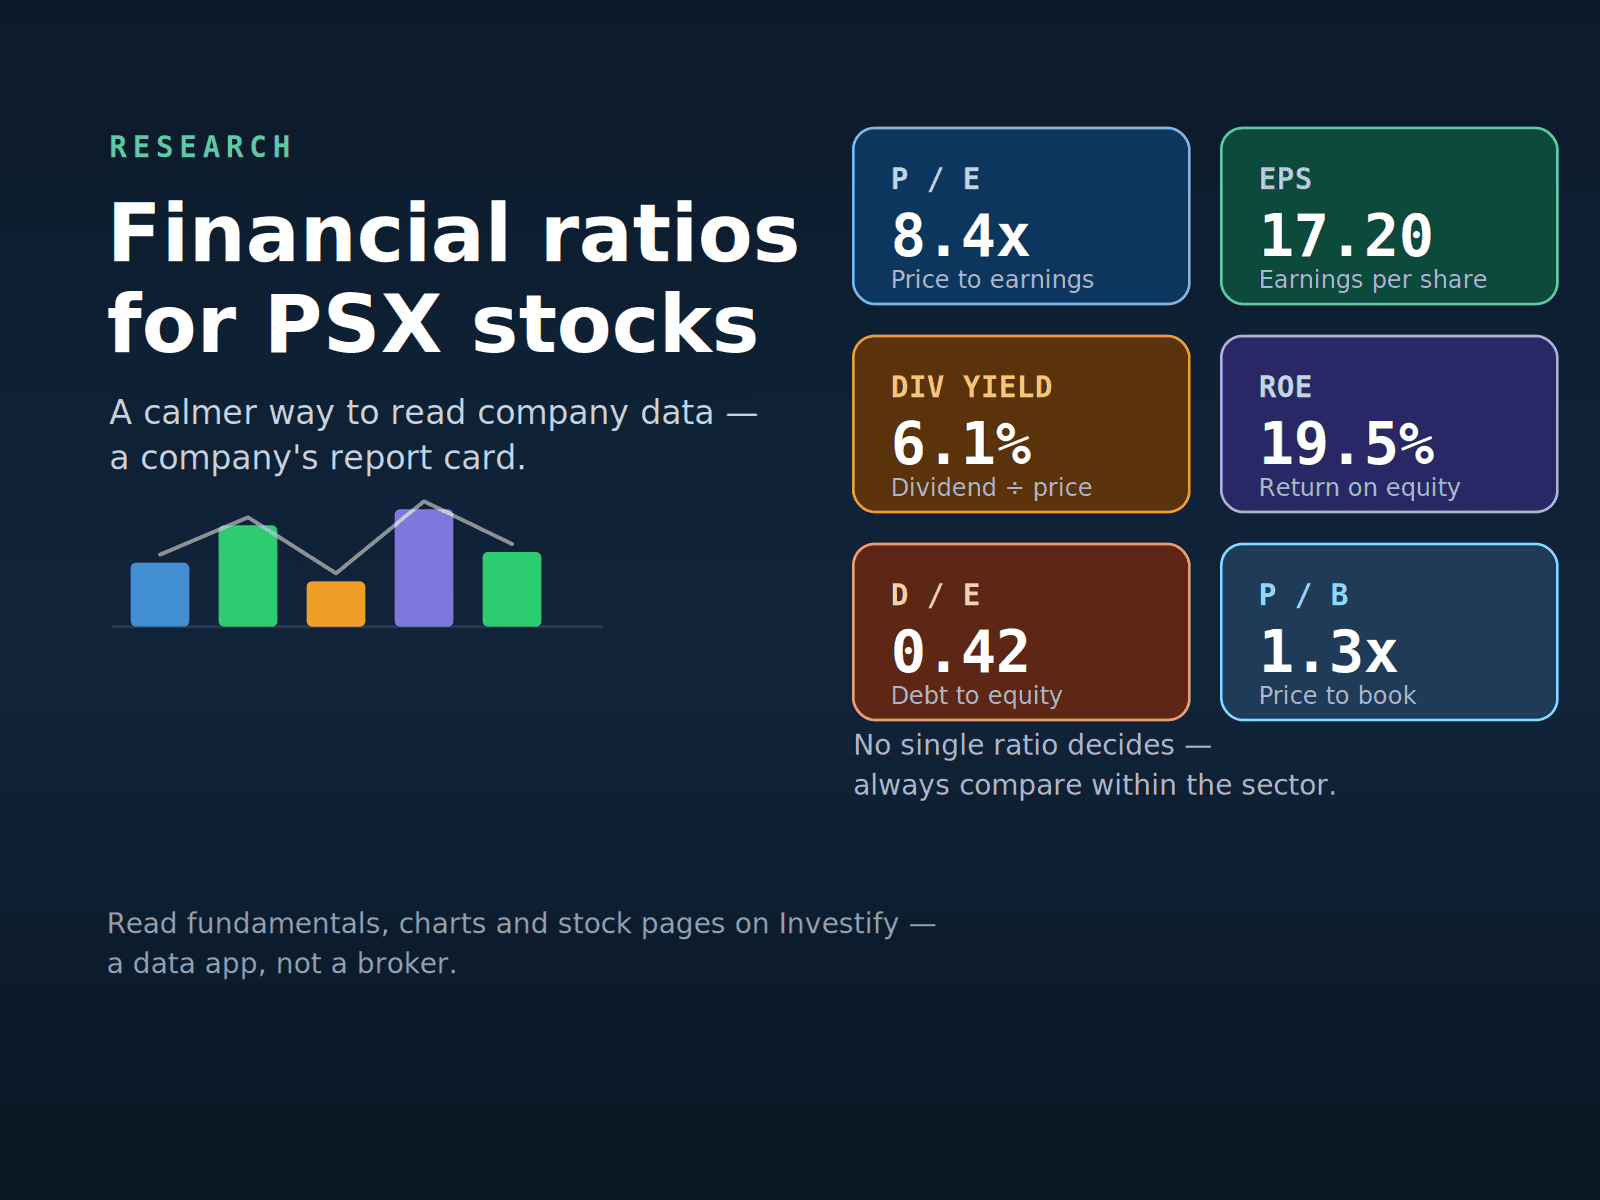
When you open a PSX stock page, alongside the price you will find a cluster of figures with names like EPS, P/E, ROE and dividend yield. These are financial ratios, and they are best thought of as a company's report card. A single grade never tells the whole story of a student, but read together, the grades give you a fair sense of strengths and weak spots. Financial ratios do the same for a listed company.
This guide keeps things practical. We will explain what the common ratios mean, give you one comprehensive table you can return to, and, most importantly, show you how to read them sensibly without falling for the simplistic rules that trip up beginners. No ratio here is a buy signal. They are tools for understanding, not instructions for action.
Key takeaways
- Financial ratios are a company's report card: useful read together, misleading read alone.
- Always compare within the same sector. Banks, cement, fertiliser, power, textile, technology and oil and gas firms have very different normal ranges, so a number that looks high or low only means something against sector peers.
- No single ratio is decisive, and no ratio predicts prices. They describe the past and present, not the future.
- Ratios can be distorted by one-off gains or losses, accounting changes, cyclical earnings, asset revaluations, debt structure or unusual market conditions, so always ask why a number looks the way it does.
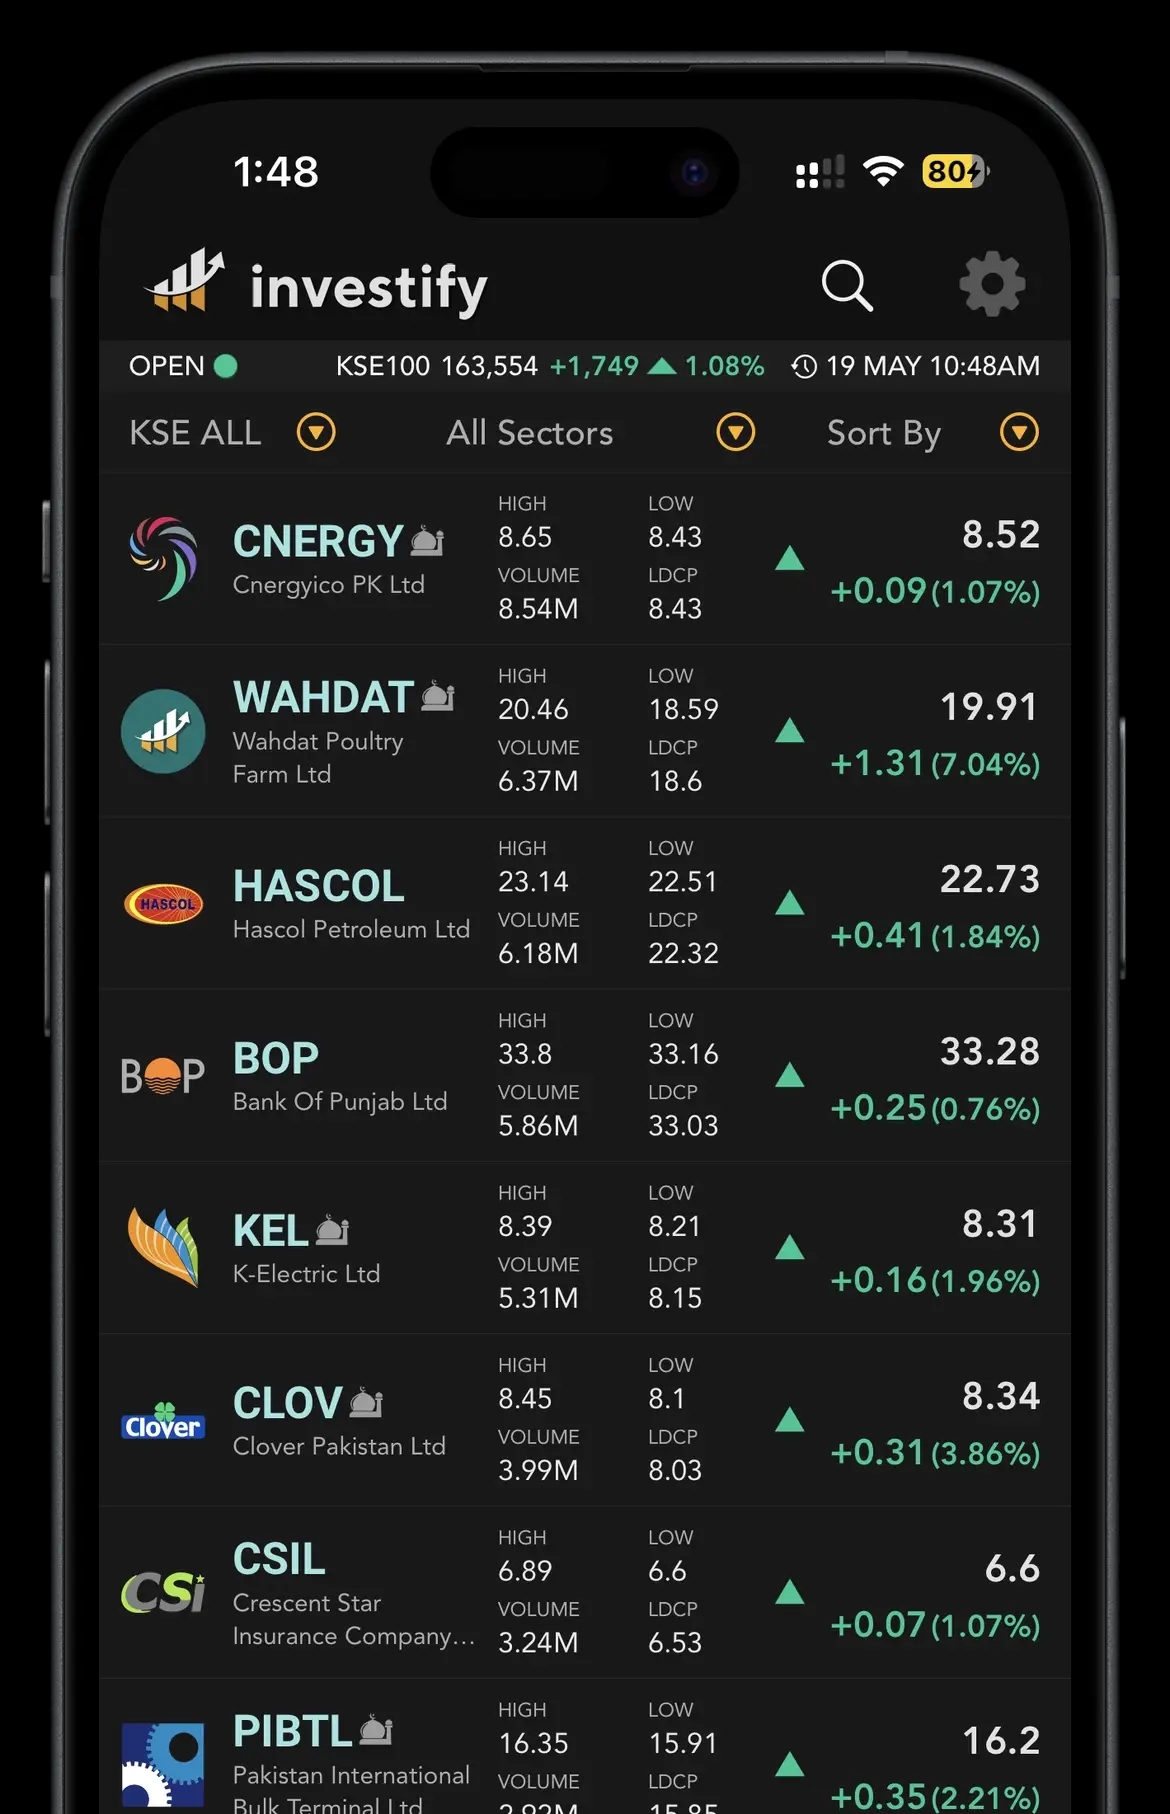
- You can view PSX stock pages, fundamentals, charts, announcements, watchlists and your portfolio on Investify, which is a data and portfolio app, not a broker. Actual trades go through your licensed broker.
Why financial ratios matter for PSX investors
A share price on its own tells you almost nothing about the business behind it. Is the company profitable? Drowning in debt? Paying healthy dividends, or stretching to pay any at all? Trading expensively relative to what it earns? Ratios turn a wall of figures from the financial statements into comparable, bite-sized answers to exactly these questions.
For a PSX investor, that comparability is the real value. Ratios let you line up a company against its own history and against its sector peers in a consistent way, so you are judging LUCK against other cement makers, or HBL against other banks, rather than guessing from the price alone.
The main financial ratios table
Here is the core toolkit. Use it as a reference, and read the "how to judge" column as guidance to ask better questions, never as a rule that a certain number is automatically good or bad.
| Ratio / metric | What it measures | How it is calculated | How to read or judge it |
|---|---|---|---|
| EPS (Earnings per Share) | Profit earned per outstanding share | Net profit divided by number of shares outstanding | Higher generally reflects more profit per share, but compare to the company's own trend and to peers. A jump may come from a one-off gain, not core business. Check the source. |
| P/E Ratio | How much investors pay per rupee of earnings | Share price divided by EPS | Compare within the sector. A low P/E is not automatically cheap. It can signal expected earnings declines or risk. Cement and banks often run lower than fast-growing names. |
| Forward P/E (if available) | P/E based on expected future earnings | Share price divided by forecast EPS | Useful for context, but it relies on estimates that can be wrong. Treat it as a projection, not a fact, and note who made the forecast. |
| Book Value per Share | Net assets backing each share | Total equity divided by shares outstanding | A rough accounting net worth per share. Can be distorted by asset revaluations or old asset values. It means more for asset-heavy firms than for asset-light ones. |
| P/B (Price to Book) | Price relative to accounting net worth | Share price divided by book value per share | Banks are often judged on P/B more than P/E. A low P/B may reflect caution about asset quality, not a bargain. Compare bank to bank, cement to cement. |
| Dividend per Share | Cash dividend paid per share | Total dividends divided by shares outstanding | Look at consistency over years, not one payout. A single large dividend can be a special, non-recurring distribution. |
| Dividend Yield | Dividend income relative to price | Annual dividend per share divided by share price | Depends on both dividend and price. A high yield can simply mean the price has fallen. Always check whether the dividend is sustainable by looking at the payout ratio. |
| Payout Ratio | Share of earnings paid as dividends | Dividends divided by net profit | Very high payouts near or above 100% may not be sustainable. Low payouts may mean profits are being reinvested. Norms vary by sector and growth stage. |
| ROE (Return on Equity) | Profit generated on shareholders' equity | Net profit divided by total equity | Higher can indicate efficient use of equity, but high leverage can inflate it. Compare within sector. Banks' ROE is not comparable to a textile firm's. |
| ROA (Return on Assets) | Profit generated on total assets | Net profit divided by total assets | Shows how well assets produce profit. Asset-heavy sectors such as power and cement naturally show lower ROA than asset-light ones. Judge against peers. |
| Gross Profit Margin | Profit after direct costs | Revenue minus cost of sales, divided by revenue | Reflects core product economics. It is not meaningful for banks in the usual sense. Compare like with like. |
| Operating Profit Margin | Profit from core operations | Operating profit divided by revenue | Strips out financing and one-offs better than net margin. Watch for cyclical swings in commodity-linked sectors. |
| Net Profit Margin | Bottom-line profit on each rupee of sales | Net profit divided by revenue | Can be distorted by one-off gains or losses, tax changes or finance costs. Read alongside operating margin to see what is core. |
| Debt to Equity | Reliance on borrowing vs equity | Total debt divided by total equity | Healthy levels differ hugely by sector. Routine for a capital-heavy or financial business may be alarming for a textile firm. High debt raises risk when rates rise. |
| Current Ratio | Short-term ability to cover liabilities | Current assets divided by current liabilities | Around or above 1 generally suggests short-term obligations are covered, but very high can mean idle assets. Interpretation differs for banks. |
| Free Float | Shares actually available to the public | Shares outstanding minus closely held or restricted shares | Low free float can mean thinner trading and choppier prices. Many shares may be held by sponsors or a parent company. |
| Market Capitalization | Total market value of the company's equity | Share price multiplied by shares outstanding | Size context, not quality. Large-cap is not automatically safe and small-cap is not automatically bad. It is about scale and how widely the stock is traded. |
| Paid-up Capital / Shares Outstanding | The share base of the company | Per company filings | The denominator behind per-share figures. Bonus issues, rights issues or splits change the share count and therefore per-share ratios. |
| Volume (market activity, not a financial ratio) | How actively the share trades | Number of shares traded in the period | Liquidity indicator only. High volume means easier trading, not a better company. Heavy volume happens on good and bad news alike. |
How to read ratios without overreacting
Three principles keep ratios from misleading you.
First, never judge on one number. A flattering ROE can be the product of heavy borrowing; a low P/E can hide shrinking earnings; a juicy dividend yield can be the side effect of a falling price. Read several ratios together so they cross-check each other.
Second, always ask why. Ratios are built from accounting figures, and accounting can be lumpy. A one-off gain, such as selling a property, can spike EPS and net margin for a single year. A revaluation can inflate book value. A cyclical sector, such as cement, oil and gas or fertiliser, can show wonderful margins at the top of its cycle and poor ones at the bottom. Before you trust a number, understand what produced it.
Third, separate description from prediction. Every ratio here describes what has happened or what is true now. None of them forecasts the share price. Markets also move on news, sentiment, interest rates and the wider economy, which are things no ratio captures. Use ratios to understand a business and frame questions, not to predict tomorrow.
Use Investify for your daily PSX workflow
Open market data, stock pages, charts, news, announcements, watchlists and portfolio tracking from one Investify account.
Open InvestifyCommon beginner mistakes with ratios
- Applying universal rules. "Low P/E good, high P/E bad" ignores sector norms and the reasons behind the number.
- Comparing across sectors. Holding a bank's ratios up against a tech or textile firm's leads to nonsense conclusions.
- Trusting a single year. One-off gains, tax changes or a cyclical peak can make a single year unrepresentative. Look at multi-year trends.
- Chasing high dividend yield blindly. A high yield may signal a fallen price or an unsustainable payout, not generosity.
- Confusing size with safety. A large market cap is not a guarantee, and a small one is not a disqualifier.
- Ignoring share-count changes. Bonus shares, rights issues and splits change per-share figures like EPS. Compare on a consistent basis.
- Treating ratios as predictions. They explain the present; they do not foretell the price.
How Investify helps with PSX financial ratios
Gathering these numbers by hand from financial statements is slow. On Investify you can:
- Open a stock page for any PSX company and see its key fundamentals and ratios laid out clearly.
- Use charts to view trends over time, so you judge ratios in context rather than from a single snapshot.
- Follow announcements and news: results, dividends and corporate actions that explain why a ratio just changed.
- Build watchlists to keep the companies and sectors you are studying in one place.
- Track your portfolio alongside the same market data.
Keep one boundary firmly in mind: Investify is a PSX data and portfolio-workflow app, not a broker. It is where you research and track. The actual buying and selling happens through your licensed broker. For any official figure, the company's audited financial statements and PSX/SECP disclosures are the authoritative source.
Educational note
This article is for general education only. It explains what common financial ratios mean for Pakistan Stock Exchange companies; it is not investment, financial, legal or tax advice, it does not recommend buying or selling any security, and the company symbols mentioned, such as LUCK and HBL, are neutral examples only. Ratios can be distorted by one-off items, accounting changes, cyclical earnings, revaluations and debt structure, and normal ranges differ by sector and over time. Always rely on official audited financial statements and PSX/SECP disclosures for the underlying numbers, and consult a qualified professional for personal financial or tax matters. Investify is a PSX market-data and portfolio-tracking app and is not a broker.
The bottom line
Financial ratios are one of the most useful tools a PSX investor has, provided you treat them as a report card, not a verdict. Read several together, always compare within the same sector, ask what produced each number, and remember that ratios describe the business rather than predict its share price. Use Investify to view stock pages, fundamentals, charts and announcements while you learn, build watchlists and track your portfolio, and place any actual trade through your licensed broker.
Related reading
Sources and references