

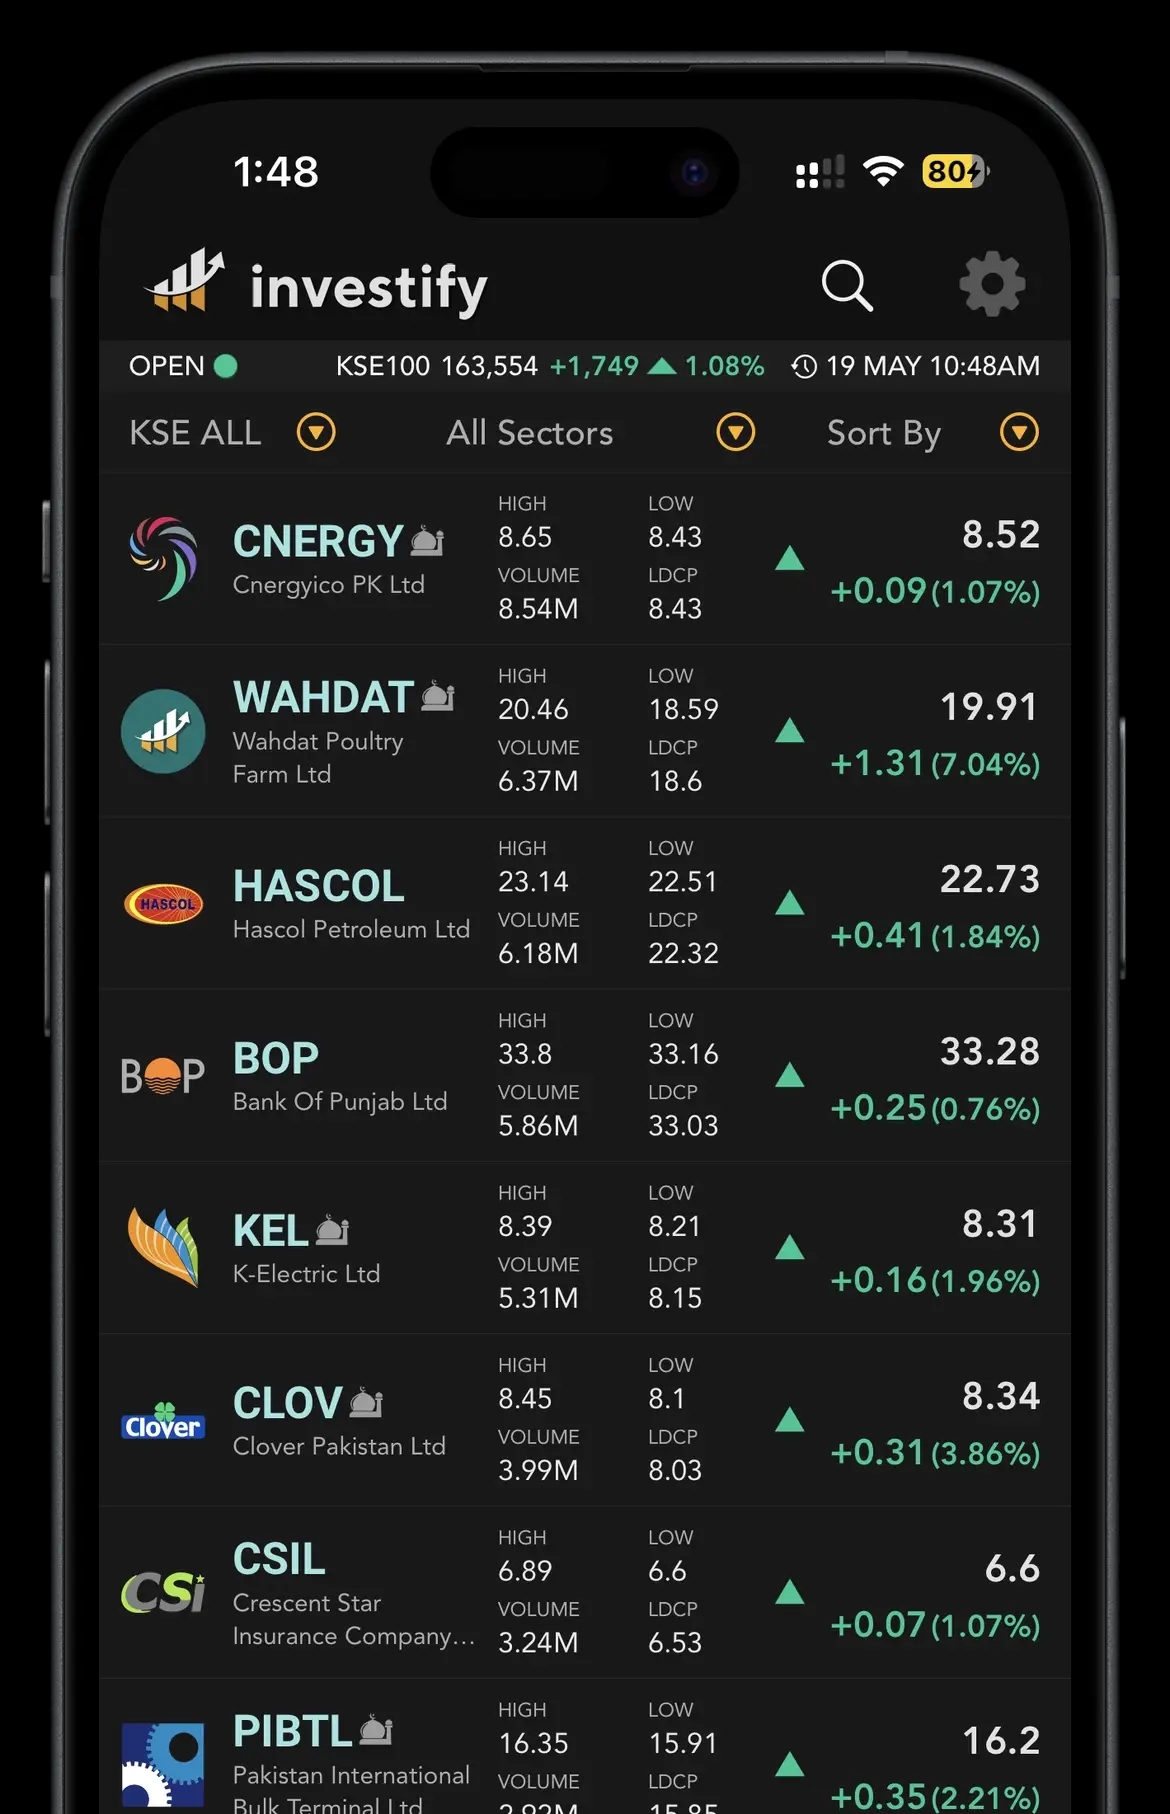
Built for PSX investors
Your market watch, portfolio and news desk in one app.
Follow live PSX prices, track holdings, read business news, and keep your watchlist close before the market moves.


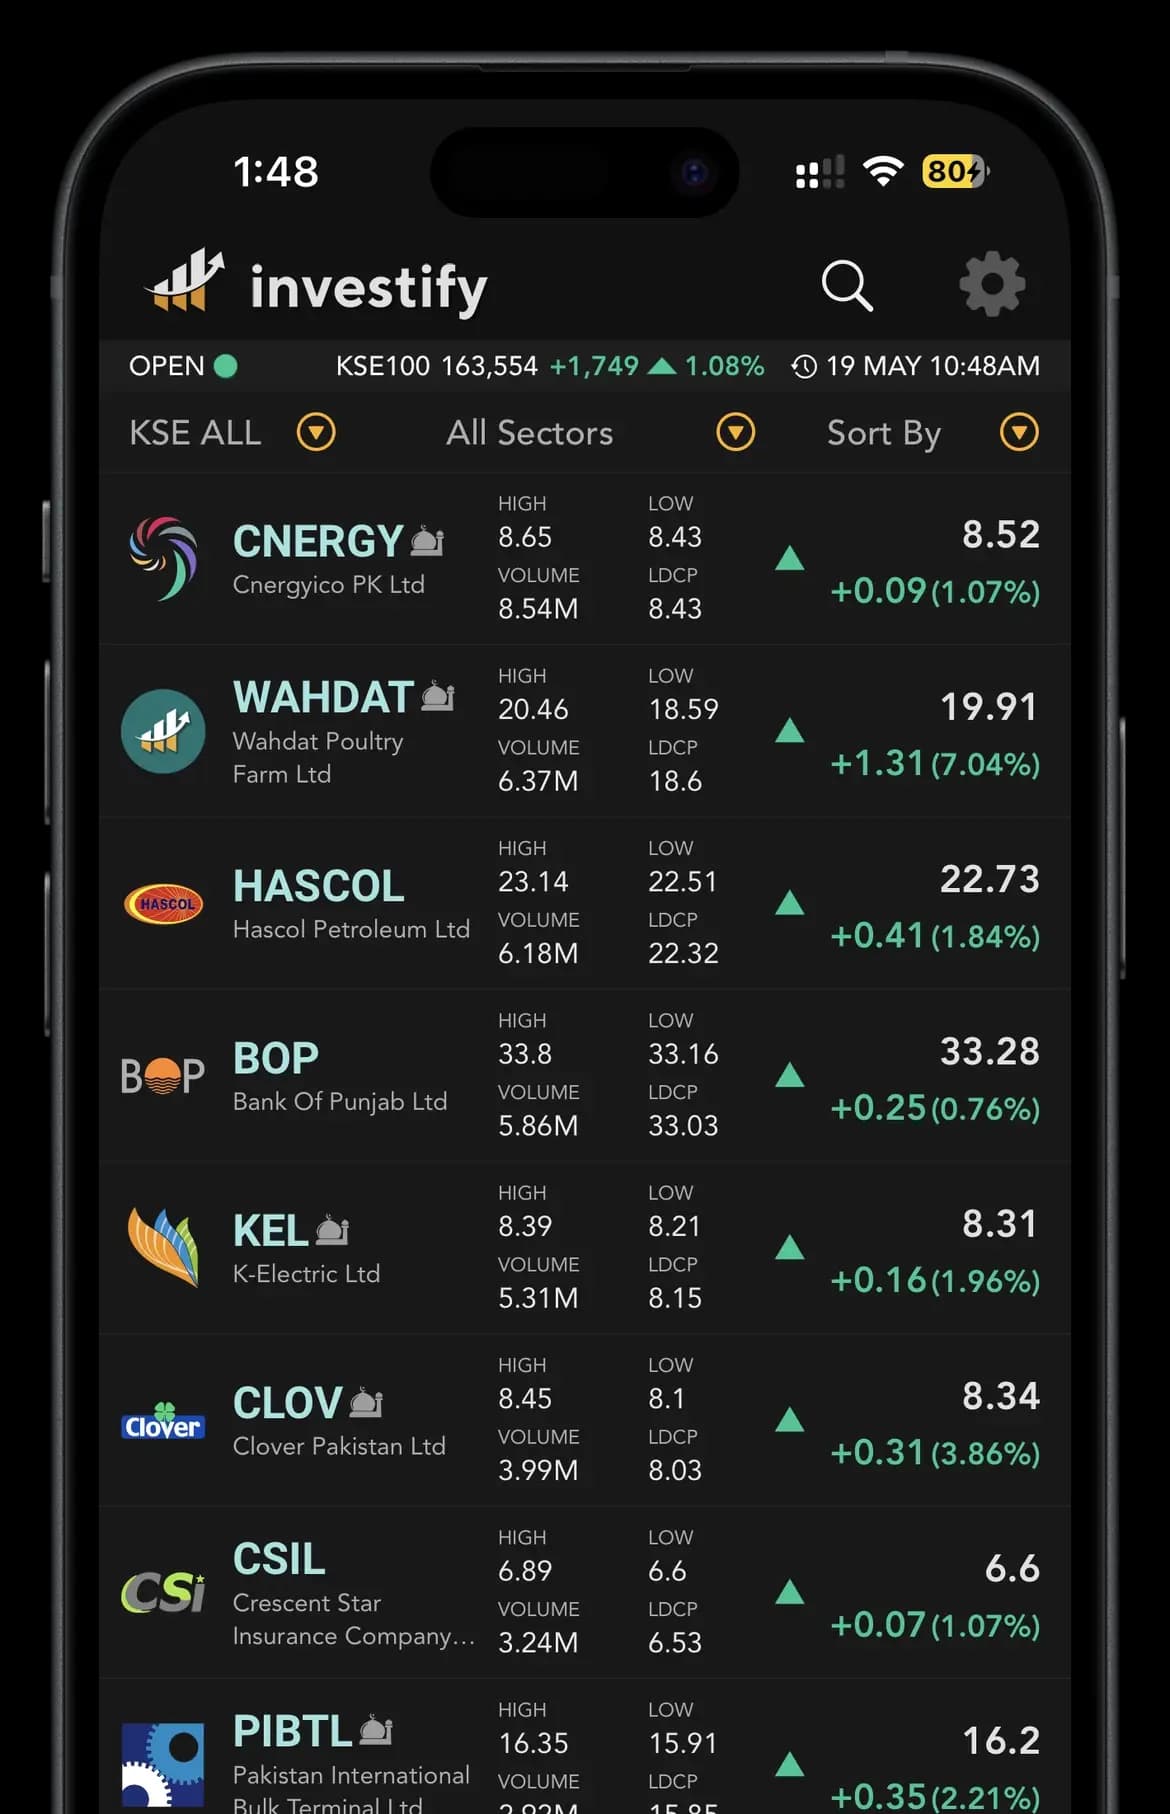
Built for PSX investors
Follow live PSX prices, track holdings, read business news, and keep your watchlist close before the market moves.
Follow live PSX prices, track holdings, read business news, and keep your watchlist close before the market moves.


Technical summary
32 indicators · Fri, Oct 9, 2026
Pivot points · today's reference levels
Crescent Jute Products Ltd (CJPL) is listed on the Pakistan Stock Exchange in the Jute sector. Explore price-based indicators, moving averages, momentum and trading ranges. These describe market behaviour and should not be treated as a forecast or an instruction to trade.
The Technicals section summarises available indicators derived from CJPL's prices and trading activity, including momentum, moving averages and trading ranges. Check the data period and update time shown with the analysis.
Moving averages smooth past prices over a chosen period. Price above or below an average describes its position relative to that trend; it does not guarantee that the next move will continue or reverse.
No. Oscillators such as RSI describe recent momentum. Strong trends can remain overbought or oversold, so read indicators alongside volume, company results and your own risk limits.
Open the share-price page to explore the available historical chart for CJPL.
CJPL share-price chartPSX guides
A card-by-card guide to this Technicals tab, plus how to read PSX charts and indicators with the right context, not as buy or sell signals.
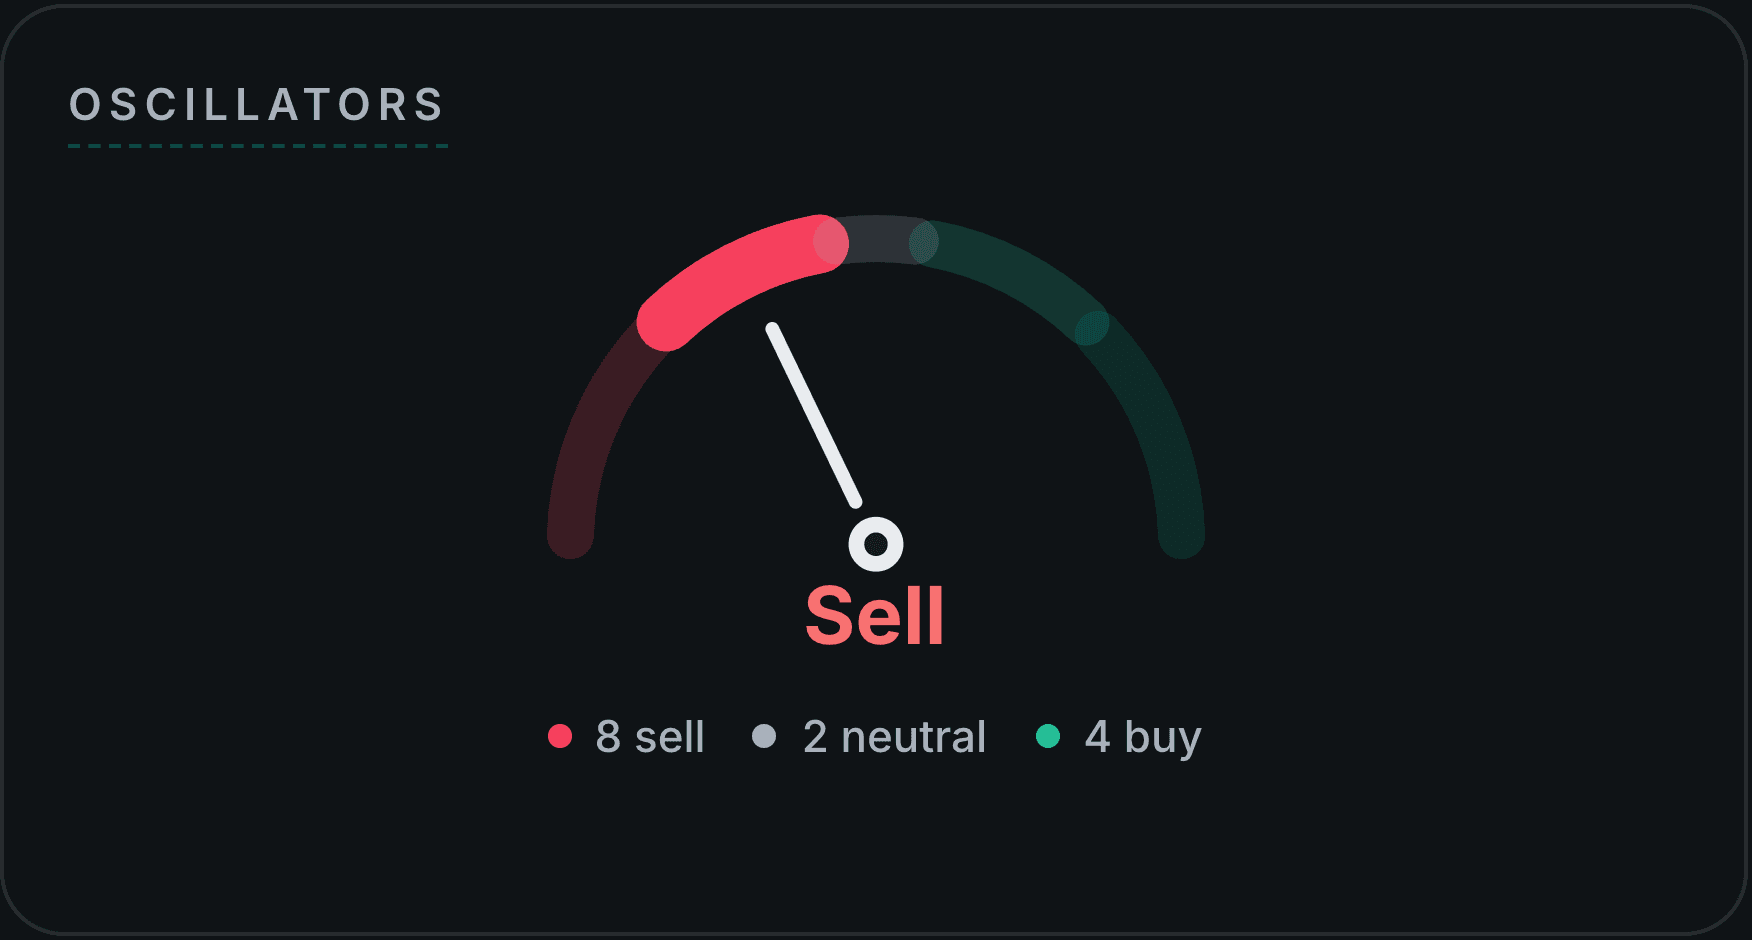
A detailed, section-by-section guide to Investify's Technicals tab for PSX stocks: the buy/sell verdict gauges, Standouts, pivots and ranges, volume, every oscillator (RSI, MACD, Stochastic, ADX and more), moving averages, Bollinger Bands and ATR, all explained in plain English.
Read guide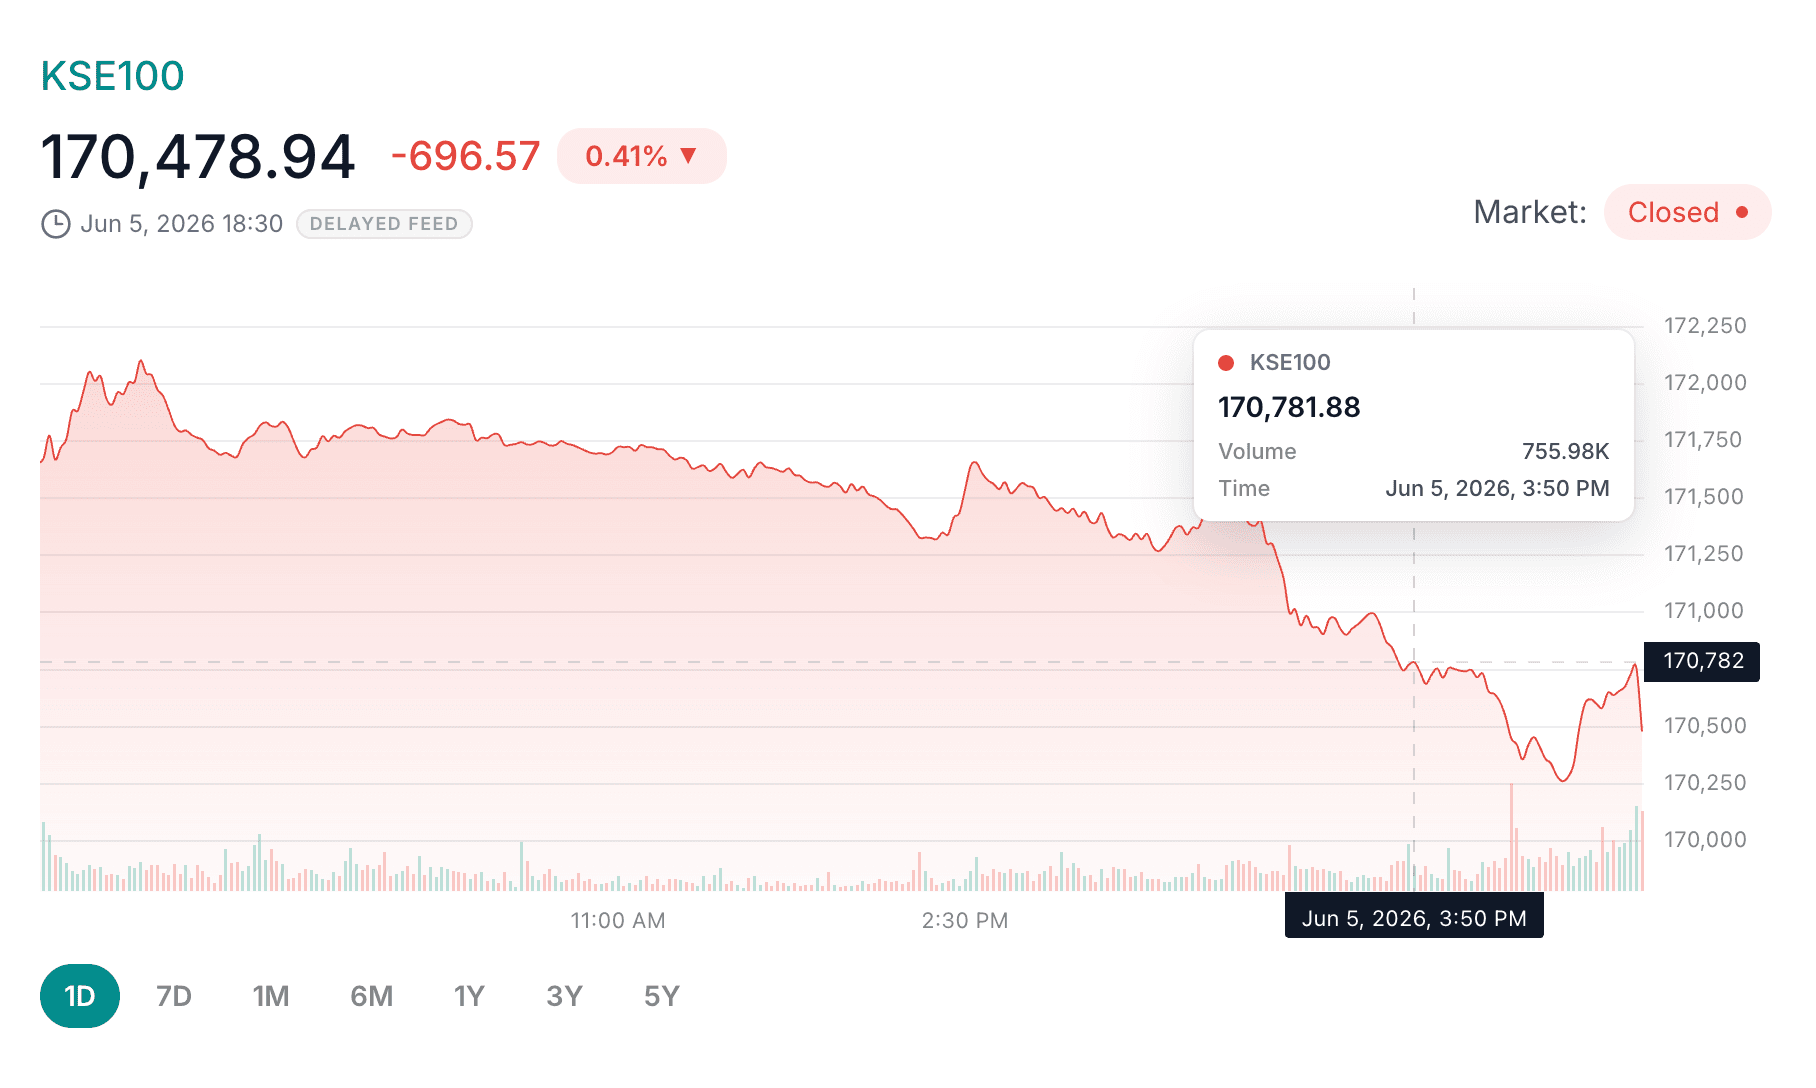
Learn how to read PSX stock charts, price trends, volume bars, timeframes, day range and technical indicators without treating charts as guaranteed predictions.
Read guide
A practical PSX company research checklist for beginners: read stock pages, fundamentals, charts, technicals, announcements, annual reports and market news before buying.
Read guideData source: Market data is provided under a Pakistan Stock Exchange data license held by Recube Technologies (investify.pk), listed on the official PSX services page. Quotes, charts and derived figures are for information only and may be delayed, adjusted or revised by the exchange.
Not financial advice: Investify is not a brokerage and does not provide investment, trading or financial advice. Nothing on this page is a recommendation to buy or sell any security. Do your own research or consult a licensed advisor before making investment decisions. Read our data & editorial policy.
Follow live PSX prices, track holdings, read business news, and keep your watchlist close before the market moves.