

Built for PSX investors
Your market watch, portfolio and news desk in one app.
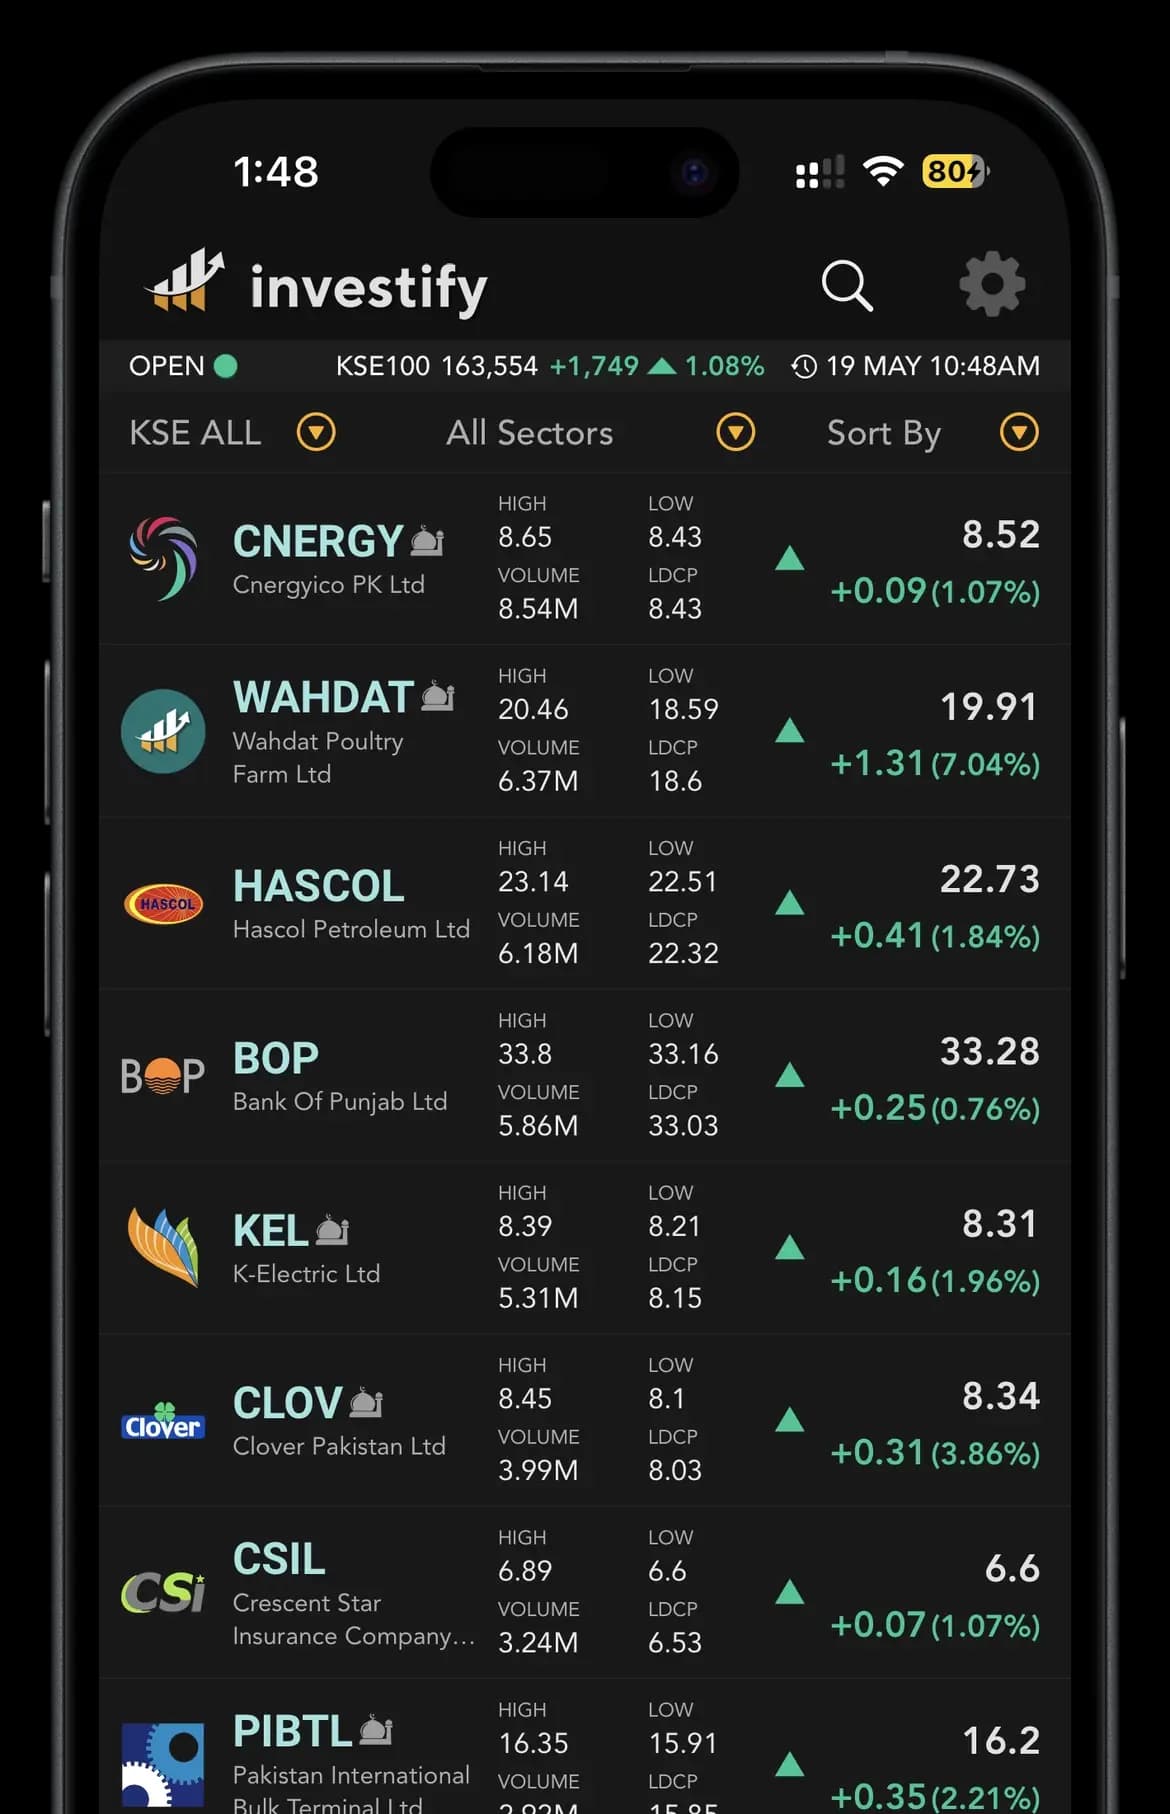
Follow live PSX prices, track holdings, read business news, and keep your watchlist close before the market moves.


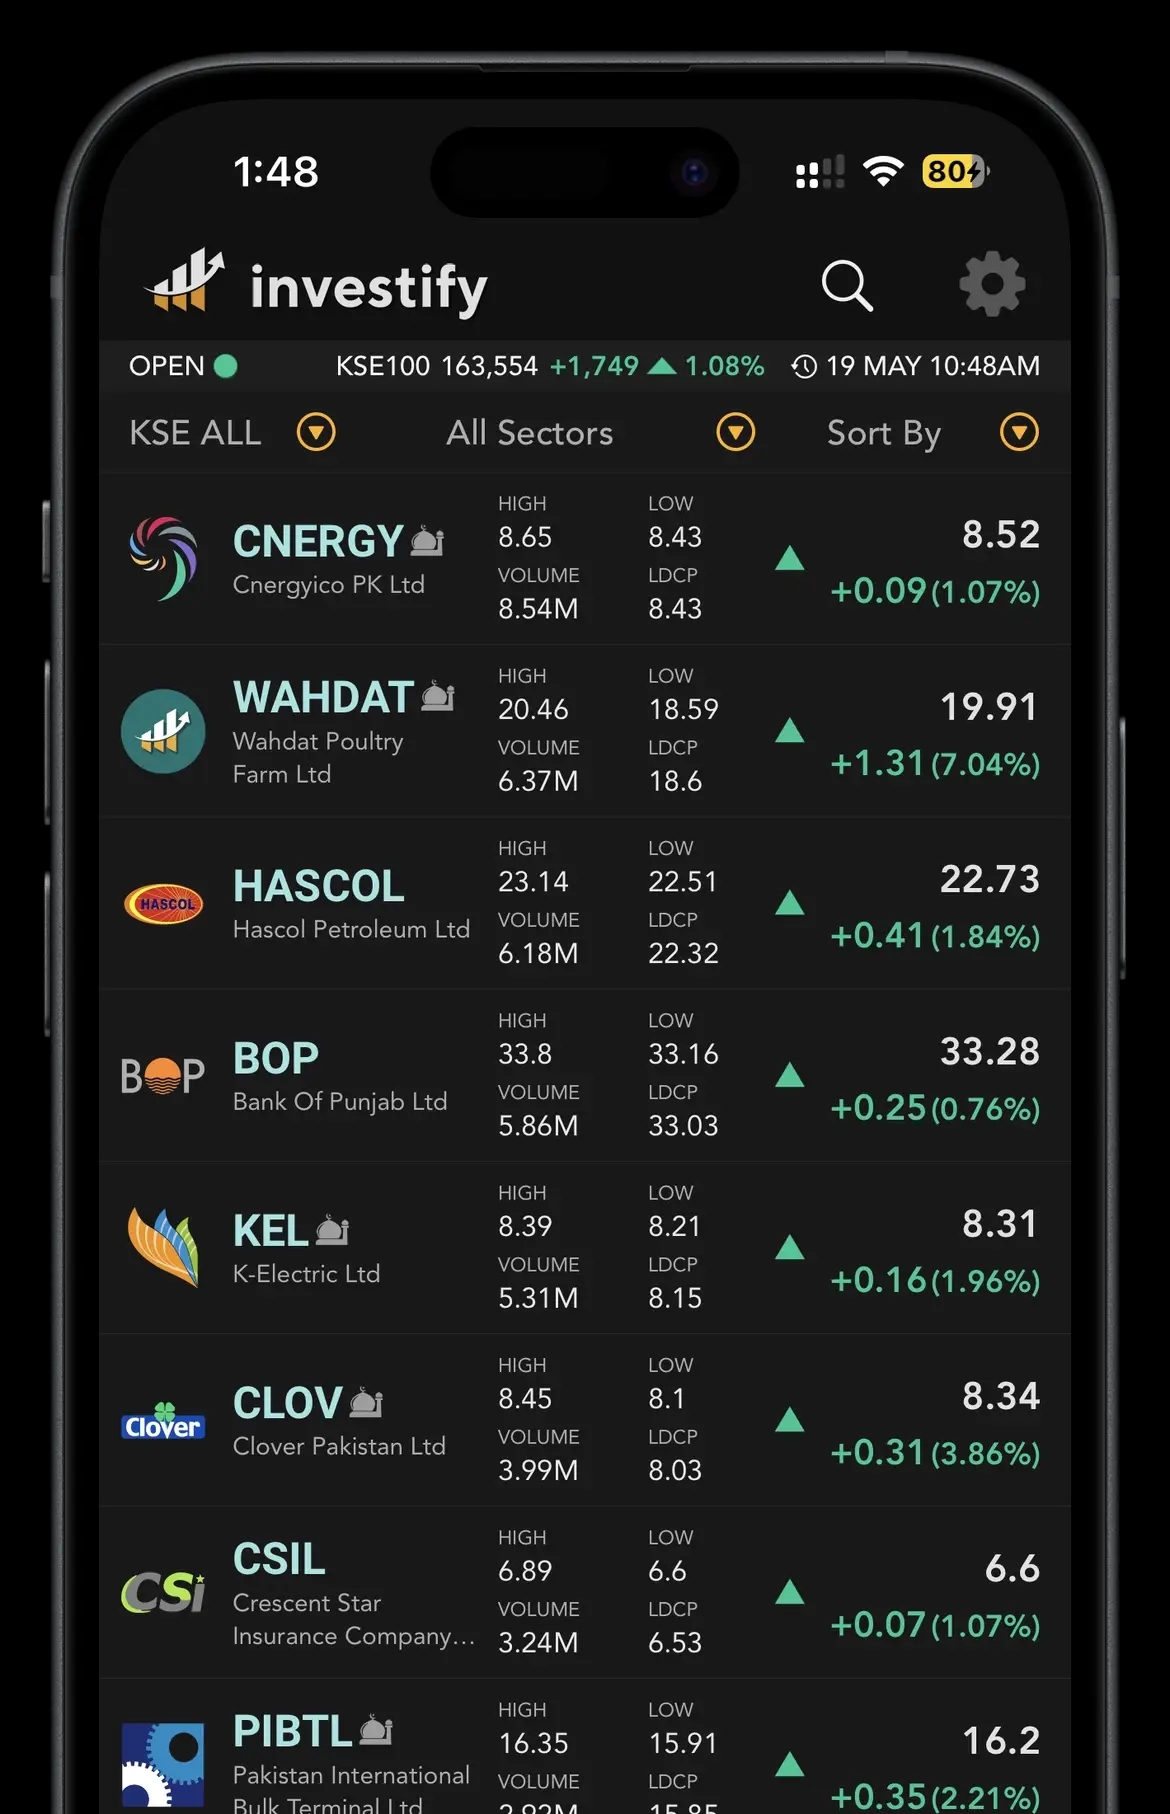
Built for PSX investors
Follow live PSX prices, track holdings, read business news, and keep your watchlist close before the market moves.
Follow live PSX prices, track holdings, read business news, and keep your watchlist close before the market moves.

Snapshot
Open
12.30
Prev Close
12.23
Volume
374,564
Current
12.20
Free Float
156,885,038
Shares
285,245,524
Ranges
Day Range
Day Low
12.01
Day High
12.49
52-Week Range
52 Week Low
9.01
52 Week High
15.69
Circuit Breaker
Lower Lock
11.01
Upper Lock
13.45
Symmetry Group Ltd (SYM) is listed on the Pakistan Stock Exchange in the Technology & Communication sector. Symmetry Group Ltd (SYM) has an available PSX quote of PKR 12.20 as of 9 OCT 6:31 PM (Pakistan time), down PKR 0.03 (0.25%) from the previous close. This is the displayed market snapshot, not a new trade each time you open the page.
Symmetry Group Ltd (SYM) has an available PSX quote of PKR 12.20 as of 9 OCT 6:31 PM (Pakistan time), down PKR 0.03 (0.25%) from the previous close. This is the displayed market snapshot, not a new trade each time you open the page.
The displayed session's range is PKR 12.01 to PKR 12.49. The available 52-week range is PKR 9.01 to PKR 15.69.
The displayed quote reports 374,564 shares traded in the session. Volume counts shares, whereas traded value measures the money exchanged. A high volume alone does not establish buying or selling pressure.
Use the price-history chart on this page and its available date ranges to explore SYM's past prices. Historical performance does not predict the next price move.
SYM historical price chartThe Fundamentals section shows available period-based earnings, dividends and valuation figures. For announcement dates and payout terms, open the company's Announcements section.
SYM dividends and financial resultsInvestify's available membership data places SYM in KSEALL, KMIALL. Membership can change when indices are reviewed.
Place real orders through your brokerage account. Investify helps you research SYM, add it to a watchlist, record trades and track your portfolio; recording a transaction in Investify does not execute an exchange trade.
Compare the quote timestamps, market status and feed access. A signed-out market snapshot and a signed-in live quote may update at different times. After trading stops, the last available quote can remain on screen until the source updates again.
PSX guides
Short guides on what the price, change, volume, bid, ask and day range on this page actually mean.
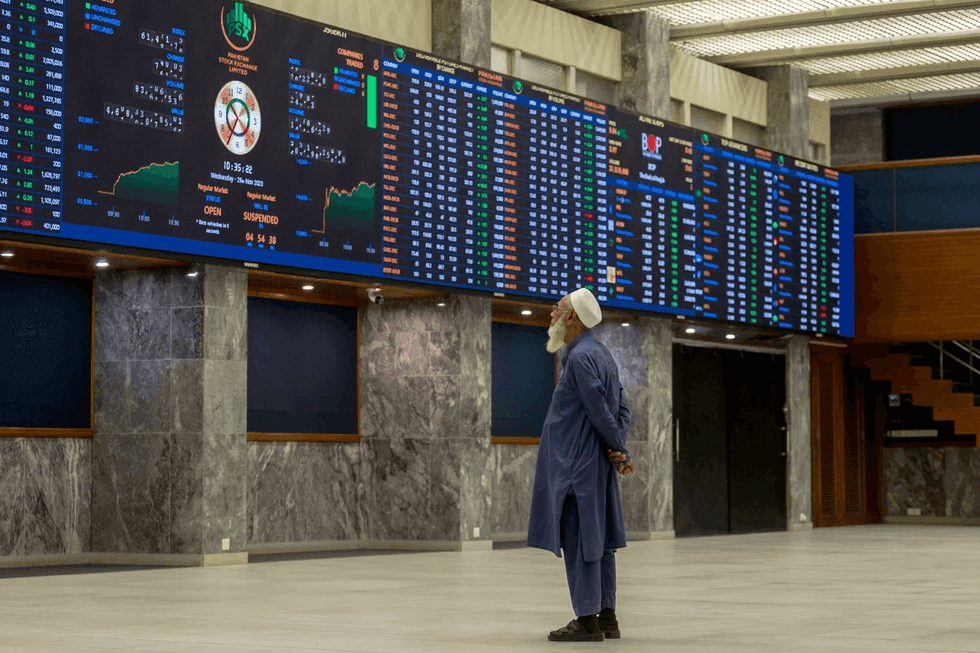
Learn how to read a Pakistan Stock Exchange quote, including current price, change, volume, bid, ask, day range, market status and what each field means for everyday PSX investors.
Read guide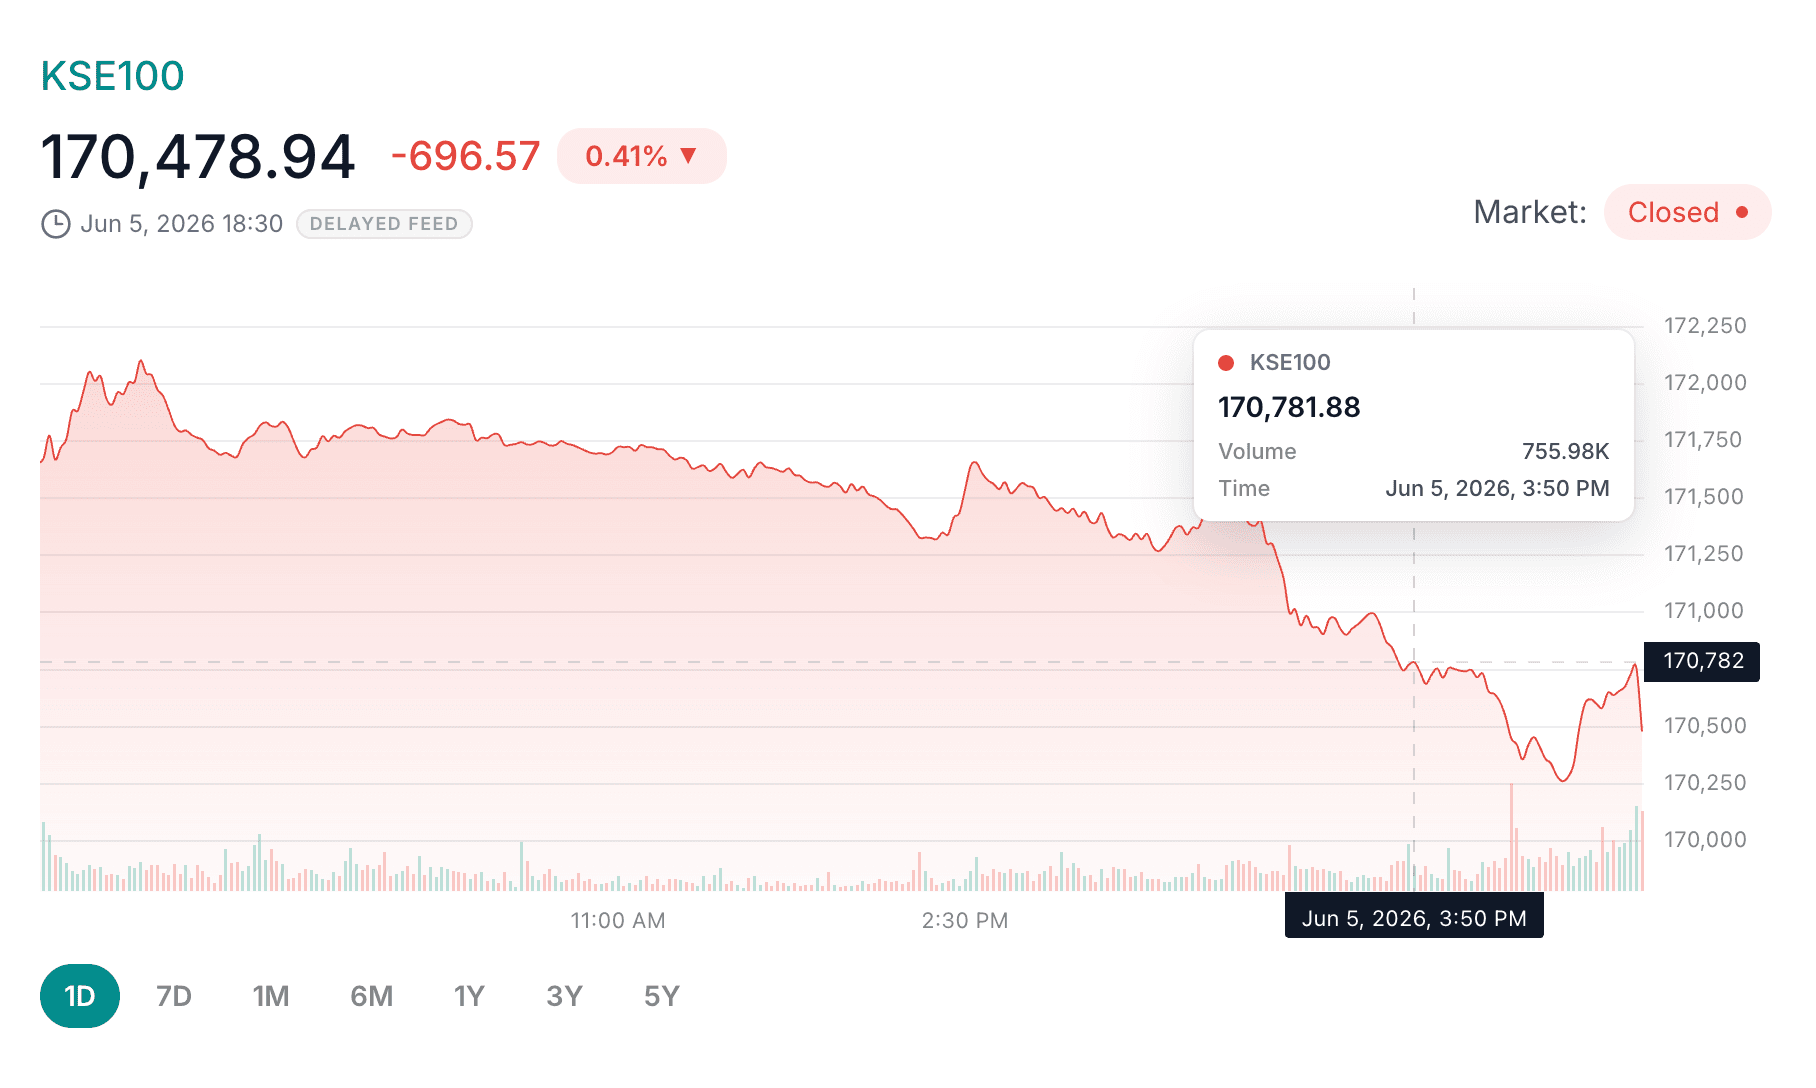
Learn how to read PSX stock charts, price trends, volume bars, timeframes, day range and technical indicators without treating charts as guaranteed predictions.
Read guide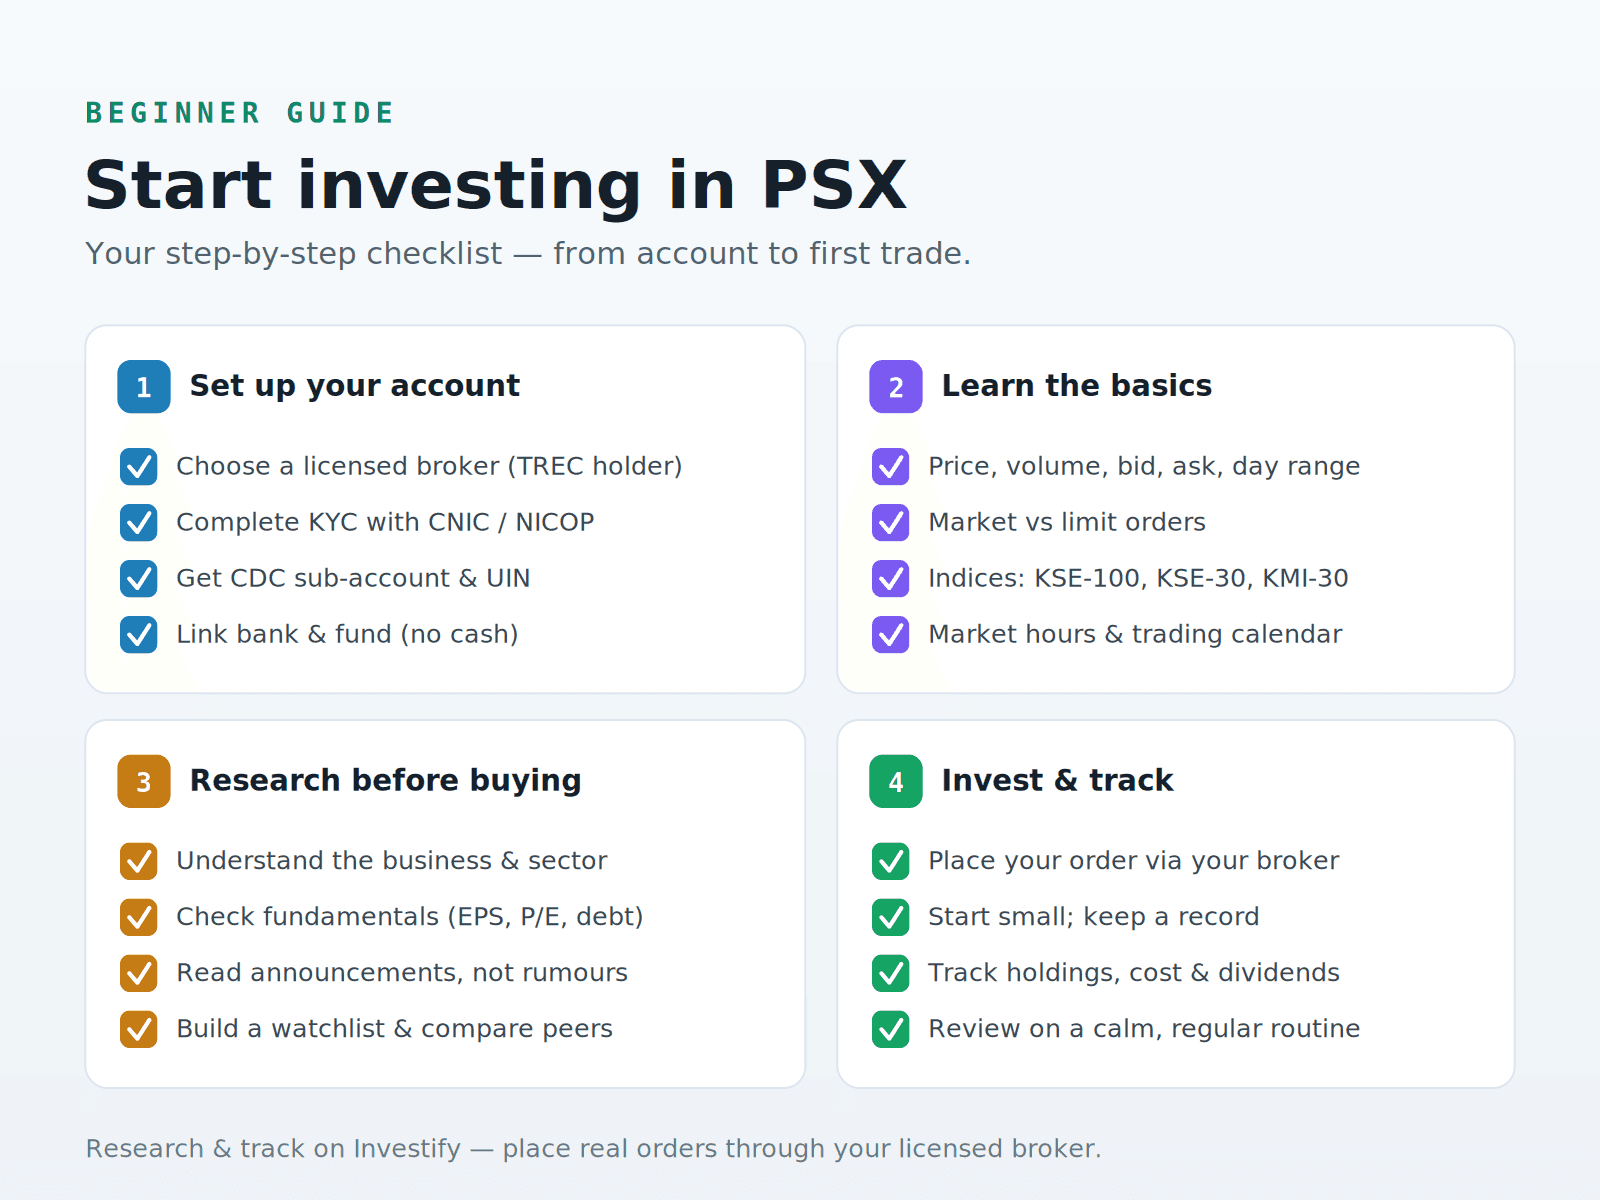
A complete beginner guide to investing in the Pakistan Stock Exchange: account setup, brokers, PSX concepts, research, risk management, portfolio tracking and daily market routines.
Read guideData source: Market data is provided under a Pakistan Stock Exchange data license held by Recube Technologies (investify.pk), listed on the official PSX services page. Quotes, charts and derived figures are for information only and may be delayed, adjusted or revised by the exchange.
Not financial advice: Investify is not a brokerage and does not provide investment, trading or financial advice. Nothing on this page is a recommendation to buy or sell any security. Do your own research or consult a licensed advisor before making investment decisions. Read our data & editorial policy.
Follow live PSX prices, track holdings, read business news, and keep your watchlist close before the market moves.