


How to Read PSX Financial Results: EPS, Revenue, Profit, Dividends and What They Mean
When a company listed on the Pakistan Stock Exchange releases its financial results, the market pays attention, and so should you. But if you have ever opened a results announcement and felt lost in a wall of numbers, you are not alone. This guide is a calm, plain-English walk-through of how to read PSX company results, so that terms like revenue, margin, EPS, profit before tax and cash flow start to make sense.
You do not need an accounting background to follow along. By the end, you will know what to look at first, what each figure is telling you, and how to review a new result sensibly using Investify.
What PSX financial results tell you
A financial-results announcement is a listed company's official report on how it performed over a period of time. It is one of the most important types of company disclosure, and it is shared with the whole market at once so that every investor sees the same information together. If you would like a broader overview of how disclosures work, our guide on PSX company announcements covers the full range of notices a company issues.
A PSX earnings announcement usually contains three connected stories:
- The income statement (profit and loss): how much the company sold, what it cost, and what was left as profit.
- The balance sheet: what the company owns and owes at a point in time.
- The cash flow statement: how much actual cash moved in and out.
Reading results well means looking at all three together, rather than reacting to a single headline number.
The main parts of a financial-results announcement
Quarterly, half-yearly and annual results
Companies report at regular intervals, and knowing which period you are looking at matters:
- Quarterly results cover a three-month period and give a frequent, if less detailed, view.
- Half-yearly results cover six months and are often more detailed.
- Annual results cover the full financial year and are the most complete, typically accompanied by the fullest disclosures and, where applicable, a proposed final dividend.
"Quarterly results PSX" and annual results are not directly comparable to each other, because one covers three months and the other twelve. Always compare like with like.
How to read revenue, profit and margins
This is the heart of understanding profit and revenue in stock analysis. Let us move down the income statement, one line at a time.
Revenue (sales)
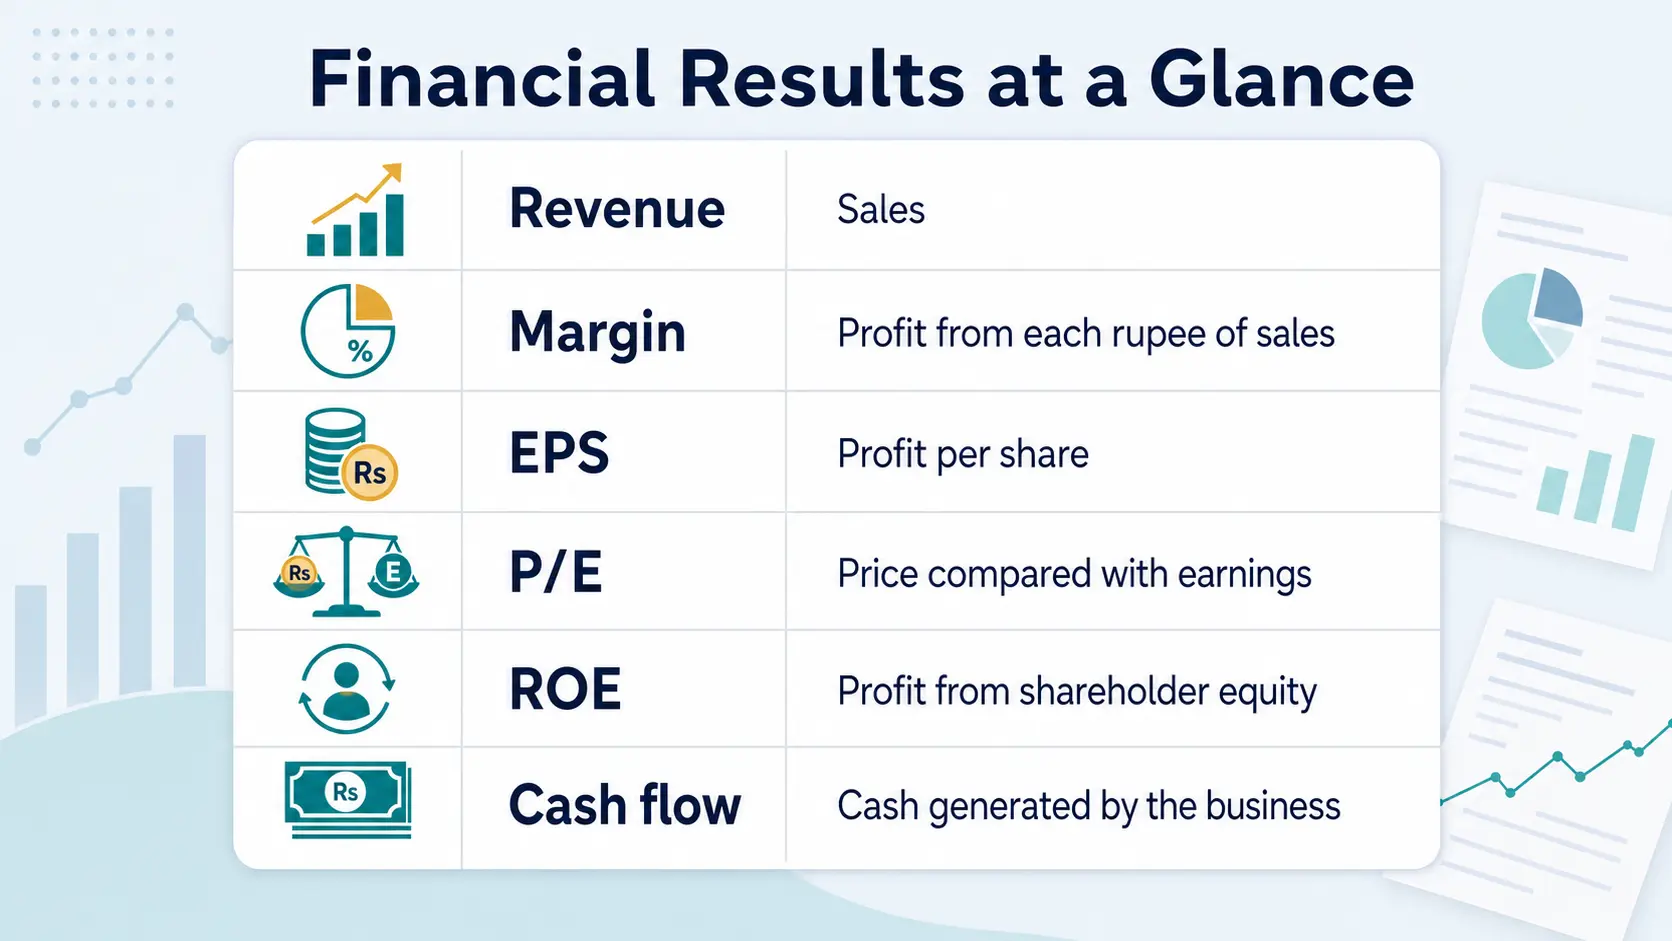
Revenue, sometimes called turnover or sales, is the total value of goods or services the company sold in the period. It sits at the top of the income statement, which is why people call it the "top line." Rising revenue suggests the business is growing, but revenue alone does not tell you whether the company actually made money.
Gross profit and gross margin
Gross profit is revenue minus the direct cost of producing the goods or services (the cost of sales). Gross margin expresses this as a percentage:
Gross margin = gross profit ÷ revenue
Margin matters because it shows how much of each rupee of sales survives after direct costs. A company can grow revenue while its gross margin shrinks, for example if raw-material or energy costs rise faster than prices.
Operating profit and operating margin
Operating profit is what remains after also subtracting the running costs of the business, such as salaries, marketing and administration. Operating margin is operating profit divided by revenue. This figure tells you how profitable the core business is, before the effects of borrowing and tax.
Finance costs and debt
Finance cost is mainly the interest a company pays on its borrowings. A business with a lot of debt will carry a heavier finance cost, and that cost can eat into profit, especially when interest rates are high. Watching finance costs alongside the company's debt level helps you understand how much of the profit is being consumed by borrowing.
Profit before tax and profit after tax
- Profit before tax (PBT) is what is left after finance costs and other items, but before tax.
- Profit after tax (PAT), also called net profit or the "bottom line," is what remains once tax is deducted.
PAT is the figure most people mean when they say a company "made a profit." It is also the number used to calculate earnings per share.
Understanding EPS
What EPS is and why it matters
EPS (earnings per share) is profit after tax divided by the number of shares:
EPS = profit after tax ÷ number of shares
EPS translates a large profit figure into a per-share number, which is far more useful to an ordinary investor. It lets you compare a company against its own past performance and against others, regardless of how many shares each has issued. When people discuss EPS meaning in Pakistan stocks, this is the idea: it is the slice of profit attributable to each single share.
Basic EPS versus diluted EPS
You will often see two versions:
- Basic EPS uses the current number of ordinary shares.
- Diluted EPS assumes that things which could turn into new shares in the future (such as certain convertible instruments) actually do. Because that would spread the same profit across more shares, diluted EPS is usually a little lower.
For most beginners, the simple takeaway is this: diluted EPS is the more cautious figure, because it reflects the "what if more shares existed" scenario.
Dividends and payout decisions
A dividend is a portion of profit paid out to shareholders. Companies often announce a dividend alongside their results. But a dividend is a decision, not an automatic outcome of profit. A board may choose to pay out a large share of earnings, a small share, or nothing at all, keeping the money to reinvest or to strengthen the balance sheet.
This is why a company can report lower profit yet keep its dividend steady, or report higher profit and still pay little, sometimes drawing on cash and reserves built up earlier. When you see a PSX dividend announcement, read it next to the profit figure and ask how comfortably the profit and cash generated cover the payout.
Profit versus cash flow
Here is one of the most important lessons for a new investor: accounting profit is not the same as cash.
Profit is calculated using accounting rules. A sale can be recorded as revenue before the customer has actually paid, and some costs are spread over time rather than paid all at once. Cash flow, shown in the cash flow statement, tracks the real money moving in and out.
A healthy business generally turns its profit into cash over time. If a company reports solid profit but its cash generated from operations is persistently much weaker, that gap is worth understanding. It can reflect ordinary timing differences, or it can be a sign that money is tied up in unpaid invoices or unsold inventory.
What to check on the balance sheet
The balance sheet is a snapshot of what a company owns and owes on the reporting date. A few beginner-friendly things to notice:
- Debt (borrowings): Is it rising or falling? Higher debt usually means higher finance costs.
- Cash and equivalents: How much ready cash does the business hold?
- Trade receivables: Money owed by customers. A sharp rise can mean sales are being made but not yet collected.
- Inventory (stock): Goods not yet sold. A large build-up can tie up cash.
- Equity: The shareholders' portion of the company after subtracting what it owes.
You do not need to master these on day one. Simply noticing whether debt is climbing and whether cash is healthy already puts you ahead of many beginners. Our beginner financial ratios guide explains how these items combine into simple, useful ratios.
How to compare results properly
A single result means little in isolation. Context comes from comparison.
Year-over-year versus quarter-over-quarter
- Year-over-year (YoY) compares a period with the same period a year earlier, for example this quarter versus the same quarter last year. This is usually the fairer comparison, because it accounts for seasonal patterns.
- Quarter-over-quarter (QoQ) compares consecutive quarters. It shows momentum but can be distorted by seasonality, such as festival-season sales.
One-off gains and losses
Sometimes profit is boosted or dragged down by a one-off item, such as a gain from selling an asset or a large one-time charge. These do not reflect the ongoing business. If last year's profit included a one-off gain, this year may look weak by comparison even if the core business improved. Reading the notes that accompany the results helps you spot these.
Comparing within the same sector
Margins and growth rates differ widely across industries. A "good" margin for a supermarket is very different from a "good" margin for a software firm. To judge a result fairly, compare a company with peers in the same sector, not with unrelated businesses.
A worked example (fictional figures)
Let us walk through a fictional company, Karakoram Consumer Foods Limited, to see how the pieces fit together. Every number below is illustrative and invented purely to teach the method. It is not real data and is not a view on any actual company.
Here are its half-year (H1) results compared with the same half-year a year earlier:
| Line item (PKR millions unless stated) | H1 this year | H1 last year |
|---|---|---|
| Revenue | 12,000 | 10,000 |
| Gross profit | 3,000 | 2,800 |
| Gross margin | 25.0% | 28.0% |
| Operating profit | 1,800 | 1,700 |
| Operating margin | 15.0% | 17.0% |
| Finance cost | 600 | 400 |
| Profit before tax | 1,200 | 1,300 |
| Profit after tax | 840 | 910 |
| EPS (PKR per share) | 2.80 | 3.03 |
| Interim dividend (PKR per share) | 1.50 | 1.50 |
| Cash from operations | 600 | 900 |
| Total debt | 6,000 | 4,000 |
(All figures illustrative. Some lines are simplified for teaching.)
What is the story here? Revenue grew a healthy 20%, which sounds encouraging. But look deeper:
- Margins fell. Gross margin dropped from 28% to 25%, and operating margin from 17% to 15%. Costs rose faster than sales, so more revenue did not translate into proportionally more profit.
- Debt and finance costs rose. Total debt increased, and finance cost jumped from 400 to 600, taking a bigger bite out of profit.
- Profit and EPS actually declined. Despite higher revenue, profit after tax fell from 910 to 840, and EPS slipped from PKR 3.03 to PKR 2.80.
- The dividend held steady at PKR 1.50, even though profit was lower.
- Cash generation weakened. Cash from operations of 600 was well below the reported profit of 840, so it is worth understanding why.
The lesson is that a growing top line does not automatically mean a stronger result. This is exactly the kind of nuance that separates "the company made a profit" from "let us understand what actually happened." Notice that none of this analysis tells you to do anything. It simply helps you understand the business more clearly.
Why the share price may react differently
New investors are often puzzled when a company reports a profit and the share price still falls. There are sensible reasons this happens.
Share prices reflect what the market expected. If investors were expecting even stronger numbers, a merely decent result can disappoint. Prices also look forward, so guidance, margins, debt trends or one-off items can matter more than the headline profit. And wider market mood plays a role too, which our guide on why the PSX is up or down today explores.
In short, "profit up" and "price up" are not the same thing, and expecting them to move together will lead you astray.
A practical Investify research workflow
Investify is a market-data, research and portfolio-tracking app. It is not a broker and does not place trades; any actual buy or sell orders are placed through your own licensed broker. What Investify does well is bring the pieces of research together so you can study a result in context.
A calm workflow looks like this:
- Spot the result. Open the Company Announcements page to see recent filings and notices, which you can review by company and by type.
- Open the company's stock page. From there you can review the company's available fundamentals, charts and announcements side by side, so the result sits next to the price and history rather than floating on its own.
- Read the numbers in context. Check revenue, margins, EPS, debt and cash flow, and compare them with earlier periods.
- See how the market reacted. Use the chart to observe the price around the announcement, and read recent news for additional context.
- Cross-reference the fundamentals. Our company research guide and PSX stock quote guide explain how to interpret the surrounding data.
Review recent company results and announcements on Investify
Open market data, stock pages, charts, news, announcements, watchlists and portfolio tracking from one Investify account.
Open Company AnnouncementsCommon mistakes beginners make
- Reading only the headline profit and ignoring margins, debt and cash flow.
- Comparing a quarter with a full year, or comparing unlike periods.
- Forgetting seasonality, so a strong festival quarter looks like permanent growth.
- Ignoring one-off items that flatter or depress a single period.
- Assuming a dividend proves strength, without checking whether profit and cash support it.
- Comparing across sectors as if their margins should match.
- Treating a result as a signal to act, rather than as information to understand.
Final checklist for reviewing a new result
When a fresh result appears, run through this simple checklist:
- Which period does this cover (quarter, half-year or full year)?
- Did revenue grow, and did margins hold up?
- What happened to operating profit and finance cost?
- Is EPS higher or lower than the comparable period?
- Was a dividend declared, and do profit and cash support it?
- How does cash from operations compare with reported profit?
- Is debt rising or falling?
- Were there any one-off items?
- How does this compare year-over-year and against sector peers?
- How did the price and chart respond, and what does recent news add?
Educational disclaimer
This article is for educational purposes only. It explains general concepts and is not investment, financial, legal or tax advice, and it does not recommend any stock, sector, broker or trade. All figures in the worked example are illustrative and invented to teach the method. Investify is a market-data, research and portfolio-tracking app, not a broker; any orders are placed through your own licensed broker. Always do your own research and consider speaking with a qualified professional before making decisions.
Related reading