
Monthly archive · NCCPL portfolio flows
FIPI LIPI October 2026Foreign and local investors on PSX
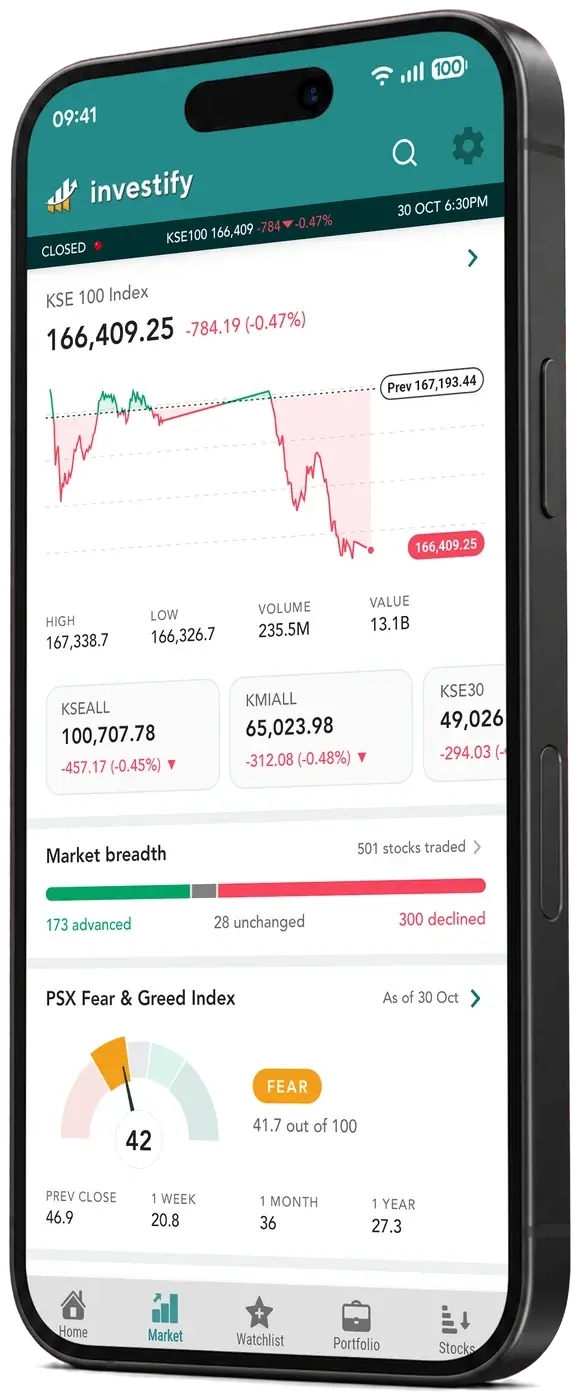
Foreign investors were net sellers of $71.3 million on PSX in October 2026, over 22 trading days, while other organisations bought $52.3 million. The KSE-100 fell 2.09% over the month.
FIPI · foreign
Net sellers-$71.3M
LIPI · local
Net buyers+$71.3M
KSE-100 in October 2026
166,409
October 2026
Who bought and who sold
1 October 2026 to 30 October 2026 (22 trading days)
FIPI, foreign
LIPI, local
| Investor type | USD | PKR | |
|---|---|---|---|
| Foreign (FIPI) | |||
| Foreign corporates | -$82.3M | -Rs 22.80B | |
| Overseas Pakistanis | +$11.1M | +Rs 3.07B | |
| Foreign individuals | -$0.05M | -Rs 15.0M | |
| Local (LIPI) | |||
| Individuals | +$43.1M | +Rs 11.93B | |
| Companies | +$15.6M | +Rs 4.33B | |
| Banks and DFIs | +$15.9M | +Rs 4.40B | |
| NBFCs | +$0.05M | +Rs 12.7M | |
| Mutual funds | -$43.8M | -Rs 12.12B | |
| Insurance companies | -$9.51M | -Rs 2.63B | |
| Brokers (proprietary) | -$2.42M | -Rs 671M | |
| Other organisations | +$52.3M | +Rs 14.49B | |
Foreign flows by sector
Net foreign buying or selling in each sector, and how locals traded the same sector.
- All other sectors-$47.7MLocal +$47.7M
- Commercial banks-$22.4MLocal +$22.4M
- Cement-$2.96MLocal +$2.96M
- Oil and gas marketing-$1.34MLocal +$1.34M
- Technology and communication+$1.32MLocal -$1.32M
- Power generation and distribution+$0.86MLocal -$0.86M
- Oil and gas exploration+$0.35MLocal -$0.35M
- Fertilizer+$0.32MLocal -$0.32M
- Textile composite+$0.29MLocal -$0.29M
- Food and personal care+$0.01MLocal -$0.01M
Who traded what: investor type by sector
Net flow in millions of US dollars. Green is net buying, red is net selling; the stronger the colour, the bigger the flow.
| Sector | Foreign corporates | Overseas Pakistanis | Foreign individuals | Individuals | Companies | Banks and DFIs | NBFCs | Mutual funds | Insurance companies | Brokers (proprietary) | Other organisations |
|---|---|---|---|---|---|---|---|---|---|---|---|
| Commercial banks | -26.3 | +3.87 | 0 | +7.90 | +0.35 | +7.07 | +0.03 | +1.05 | +2.68 | +1.96 | +1.39 |
| Cement | -3.59 | +0.65 | -0.02 | +1.87 | +7.17 | +1.27 | -0.08 | -7.47 | -0.06 | -0.49 | +0.74 |
| Fertilizer | -0.21 | +0.53 | 0 | +4.21 | +2.78 | +2.26 | +0.03 | -2.87 | -6.77 | -0.22 | +0.26 |
| Oil and gas exploration | -0.90 | +1.26 | 0 | +0.45 | +0.32 | -1.38 | +0.15 | +0.91 | +0.21 | -2.00 | +0.99 |
| Oil and gas marketing | -0.62 | -0.73 | 0 | +0.97 | -0.76 | -1.31 | +0.03 | +2.56 | -0.56 | +0.23 | +0.20 |
| Power generation and distribution | -0.47 | +1.33 | 0 | +4.37 | +0.49 | +1.63 | -0.01 | -8.54 | -0.17 | -0.05 | +1.41 |
| Technology and communication | -0.11 | +1.43 | 0 | +1.32 | -0.85 | +1.17 | -0.06 | -3.57 | +0.61 | +0.22 | -0.18 |
| Food and personal care | -0.30 | +0.34 | -0.03 | +1.95 | +1.30 | -0.69 | -0.02 | -2.41 | -0.08 | -0.05 | -0.02 |
| Textile composite | -0.01 | +0.29 | 0 | +0.61 | +0.46 | -0.32 | 0 | -1.15 | -0.22 | +0.02 | +0.31 |
| All other sectors | -49.8 | +2.12 | +0.01 | +19.4 | +4.36 | +6.20 | -0.04 | -22.3 | -5.15 | -2.04 | +47.2 |
Equity market only. NCCPL also reports trades in the PSX debt market; they are left out of every figure on this page.
Daily
Every trading day of October 2026
| Date | FIPI (USD) | FIPI (PKR) | Top local buyer | Top local seller | KSE-100 |
|---|---|---|---|---|---|
| -$44.9M | -Rs 12.44B | Other organisations +$48.9M | Companies -$5.01M | 166,409 -0.47% | |
| -$4.44M | -Rs 1.23B | Companies +$2.10M | Brokers (proprietary) -$0.72M | 167,193 +0.88% | |
| -$2.25M | -Rs 624M | Individuals +$3.37M | Insurance companies -$4.88M | 165,737 +0.77% | |
| -$3.97M | -Rs 1.10B | Mutual funds +$1.54M | Insurance companies -$0.12M | 164,467 +0.88% | |
| -$5.00M | -Rs 1.38B | Mutual funds +$2.17M | Individuals -$0.78M | 163,038 +0.41% | |
| -$1.50M | -Rs 417M | Companies +$2.58M | Banks and DFIs -$1.21M | 162,375 -0.95% | |
| -$1.36M | -Rs 377M | Banks and DFIs +$2.98M | Mutual funds -$2.63M | 163,924 -1.21% | |
| -$2.59M | -Rs 719M | Individuals +$3.95M | Mutual funds -$1.03M | 165,931 +0.47% | |
| +$0.74M | +Rs 206M | Individuals +$5.79M | Mutual funds -$5.36M | 165,152 -0.49% | |
| -$0.94M | -Rs 260M | Individuals +$2.46M | Banks and DFIs -$1.66M | 165,966 -0.27% | |
| -$0.44M | -Rs 122M | Companies +$1.28M | Mutual funds -$1.62M | 166,420 +0.14% | |
| -$0.70M | -Rs 194M | Banks and DFIs +$1.49M | Brokers (proprietary) -$1.32M | 166,186 +0.46% | |
| -$2.07M | -Rs 574M | Companies +$3.15M | Mutual funds -$2.42M | 165,418 +0.39% | |
| -$2.33M | -Rs 644M | Individuals +$1.73M | Mutual funds -$1.28M | 164,776 -0.21% | |
| +$0.05M | +Rs 13.4M | Banks and DFIs +$2.76M | Mutual funds -$6.17M | 165,124 -1.18% | |
| -$0.07M | -Rs 19.2M | Individuals +$3.77M | Mutual funds -$7.02M | 167,089 -0.21% | |
| -$0.88M | -Rs 245M | Individuals +$4.47M | Mutual funds -$5.52M | 167,442 -0.68% | |
| +$1.34M | +Rs 370M | Individuals +$1.92M | Mutual funds -$2.22M | 168,580 +0.07% | |
| -$1.73M | -Rs 478M | Brokers (proprietary) +$3.29M | Insurance companies -$1.94M | 168,460 +1.56% | |
| -$0.17M | -Rs 46.9M | Individuals +$2.74M | Mutual funds -$1.45M | 165,867 -1.36% | |
| +$0.91M | +Rs 251M | Individuals +$3.04M | Mutual funds -$3.55M | 168,155 -0.29% | |
| +$1.07M | +Rs 298M | Individuals +$3.76M | Mutual funds -$2.98M | 168,637 -0.78% |
Source: NCCPL daily portfolio investment data, received through Arif Habib Limited. Net values, equity market only. For information only, not investment advice.