
Dividend Discount Model Calculator
THE DIVIDEND
What are all its future dividends worth today?
Loading the latest figure...
Default 20%: the 10-year PIB yield of 12.85% plus about 7 points.
FFC DIVIDEND VALUE
Loading the latest PSX figures for FFC...
How the Gordon growth model works
A shareholder who never sells receives only dividends. The dividend discount model therefore values a share as all its future dividends, discounted back to today at the return you require. If the dividend is expected to grow at a steady rate forever, that endless stream has a simple closed form.
- D0
- the latest annual dividend per share (prefilled from PSX)
- D1
- next year's dividend: D0 × (1 + g)
- g
- dividend growth per year, forever
- r
- your required return, which must be higher than g
The gap (r − g) is the whole story. When it is small, the value is huge and extremely sensitive to the inputs, which is why the calculator warns when r and g are within 3 points of each other and refuses to give an answer when r is not above g.
Two stages, and the return the price implies
Many dividends do not grow at one rate forever. The two-stage model lets them grow at a higher rate for a set number of years, then settle to a stable rate. Each dividend in stage 1 is discounted individually, and the stable stream after it is valued with the Gordon formula and discounted back.
You can also turn the model around and ask what return the market price implies. Rearranging the Gordon formula gives the required return that makes value equal price:
That is next year's dividend yield plus growth. For the two-stage model there is no simple formula, so the calculator solves for the rate numerically. If the implied return is below your required return, or below what the 10-year PIB pays (12.85% at the State Bank's October 7, 2026 auction), the price is not paying you enough for the risk, on those dividend assumptions.
A worked example
A company paid Rs 15.00 per share last year. You expect dividends to grow 6% a year forever and require a return of 20%. Next year's dividend is Rs 15.90 and the Gordon value is Rs 15.90 ÷ (20% − 6%) = Rs 113.57. If the share trades at Rs 100.00, the price implies a return of 21.9% (15.9% dividend yield plus 6% growth), above the 20% you require.
| Model | Assumptions | Value per share |
|---|---|---|
| Gordon growth | g = 6%, r = 20% | Rs 113.57 |
| Two-stage | 12% for 5 years, then 5%, r = 20% | Rs 135.63 |
The two-stage value is higher than the Gordon value because the first 5 years grow at 12%, faster than the 6% the Gordon case assumes, and its implied return at Rs 100.00 is 25%. 55% of the two-stage value comes from dividends after year 5, a reminder of how much rests on the long-run assumptions.
When the model works, and when it does not
The DDM suits companies with long, steady dividend records and predictable payouts. On the PSX that often means fertiliser makers such as FFC, exploration and production companies such as OGDC, power producers such as HUBC and established banks, where a large part of profit is regularly paid out.
It fails for companies that pay no dividend, pay irregularly, or keep most of their profit to grow. There is no dividend to discount, so the value comes out at zero or absurdly low, which says nothing about the business. For those use the intrinsic value (DCF) calculator. To see what a stock pays against its price today, use the dividend yield calculator, and for what a holding pays you in rupees a year, the dividend calculator.
What this model misses
- Dividend policy can change. Companies cut or skip dividends when earnings fall or cash is tied up. Check the payout ratio and dividend cover shown with your result: a payout above 100% is drawing on reserves.
- Cash trapped in receivables. Some power and energy companies report profit but wait for payment from the government chain, which can squeeze dividends. Profit alone does not guarantee a payout.
- One-off and special dividends. If D0 includes a special payout, it overstates the steady dividend. Use a normal annual figure.
- Extreme sensitivity. A one-point change in r or g can move the value by 10% or more when the gap between them is small.
- Tax and growth. The model is before dividend tax, and it values only dividends, not the growth a company could create by reinvesting. Use your after-tax dividend as D0 for your own value, see the dividend tax calculator.
Sources and assumptions
Rates checked October 31, 2026: 10-year PIB cut-off yield 12.85% (State Bank auction, October 7, 2026), used to build the default required return of 20%.
- Myron J. Gordon, The Investment, Financing, and Valuation of the Corporation (1962): the constant growth dividend model
- John Burr Williams, The Theory of Investment Value (1938): value as the present value of dividends
- Aswath Damodaran, Investment Valuation (Wiley): dividend discount models, including two-stage
- State Bank of Pakistan, PIB auction results (latest result when checked: 10-year cut-off yield 12.85%, auction held October 7, 2026)
- Annual dividend per share, payout ratio, dividend cover and price: Investify PSX data, with the reporting period shown beside each number
A dividend discount value is the output of a model built on your assumptions, before dividend tax. It is not a price target or a recommendation to buy or sell. Results are estimates for information and planning only, not tax, legal or investment advice. Check your own case with a tax adviser, your broker or the official source before acting.
FAQ
Dividend Discount Model Calculator: common questions
What is the dividend discount model?+
The dividend discount model (DDM) values a share as the present value of all the dividends it will pay. Because a shareholder's only cash from a company is its dividends, discounting them at your required return gives what the share is worth to you. The Gordon growth version assumes dividends grow at one steady rate forever.
What is the Gordon growth formula?+
Value = D1 ÷ (r − g), where D1 is next year's dividend (the latest dividend D0 multiplied by 1 + g), r is your required return and g is the dividend growth rate. It needs r to be higher than g: if growth is equal to or above the required return, the formula gives an infinite or negative value and the calculator shows a warning.
What is the implied required return?+
It turns the model around. Instead of asking what the share is worth at your required return, it asks what return the current price implies if dividends grow as you assume: r = D1 ÷ price + g, the dividend yield on next year's dividend plus growth. Compare it with the return you require, and with the 10-year PIB yield, to see whether the price pays you enough for the risk.
Which PSX stocks suit the dividend discount model?+
Companies with long, steady dividend records and predictable payouts, such as many fertiliser, exploration and production and power companies, and established banks. It fits poorly for companies that pay no dividend, pay irregularly, or reinvest most of their profit to grow, because the model has little or nothing to value.
Why does the calculator show zero for a company that pays no dividend?+
The model values only the cash paid to shareholders. A company with no dividend has a dividend value of zero, which says nothing about its worth as a business. For those companies use the intrinsic value (DCF) calculator or a P/E-based approach.
What dividend growth rate should I use?+
Be modest. A dividend cannot grow faster than the company's earnings forever, and earnings cannot outgrow the economy forever. For the single-rate Gordon model, a rate near long-run nominal growth or below is sensible. If you expect faster growth for a while, pick Fast, then steady and let it settle to a modest rate.
Does the model account for dividend tax?+
No. It values the dividend before withholding tax. Dividend tax in Pakistan depends on your filer status and the type of company, so to value the stream for yourself, use your after-tax dividend as D0. The dividend tax calculator works out the amount.
Keep going
Related tools
Dividend Yield Calculator
Dividend yield and yield on cost for any PSX stock, from the latest annual payout.
Intrinsic Value (DCF) Calculator
A discounted earnings or cash-flow value per share, with margin of safety.
Graham Number Calculator
Benjamin Graham's fair value from EPS and book value, for any PSX stock.
PSX guides
Learn the ideas behind the numbers
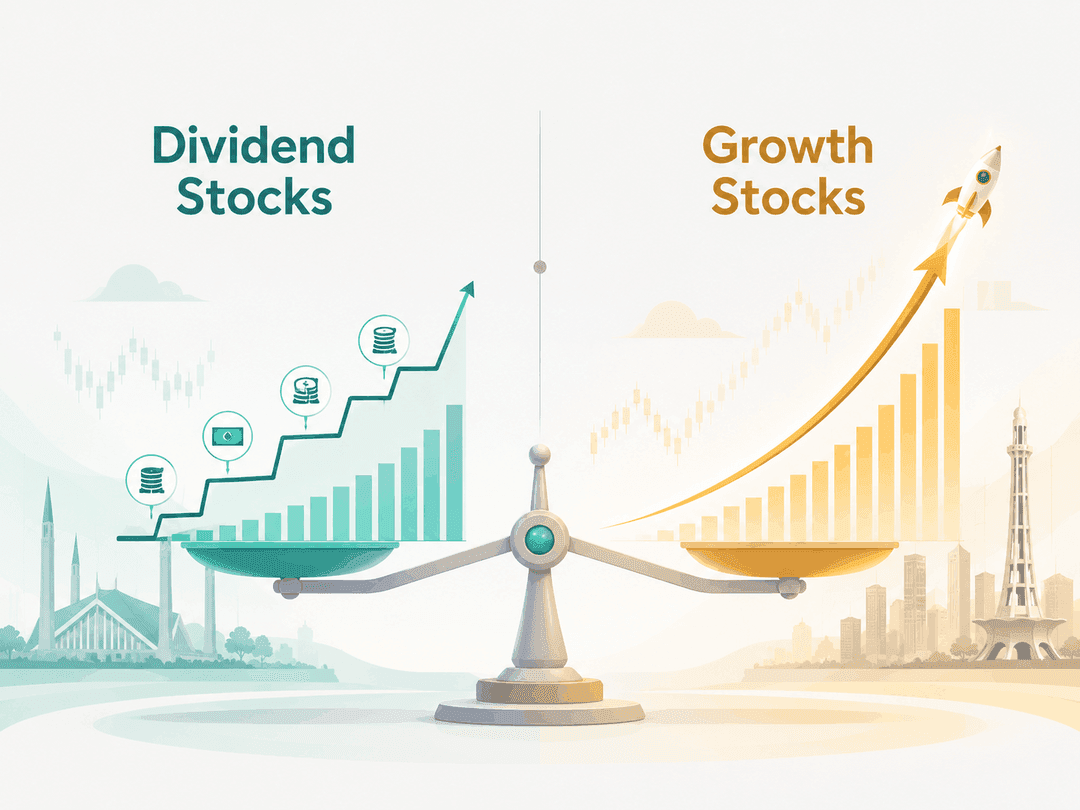
Dividend Stocks vs Growth Stocks on PSX
A beginner-friendly PSX guide comparing dividend stocks and growth stocks, including risks, investor fit, sectors, interest rates and market cycles.
Read guide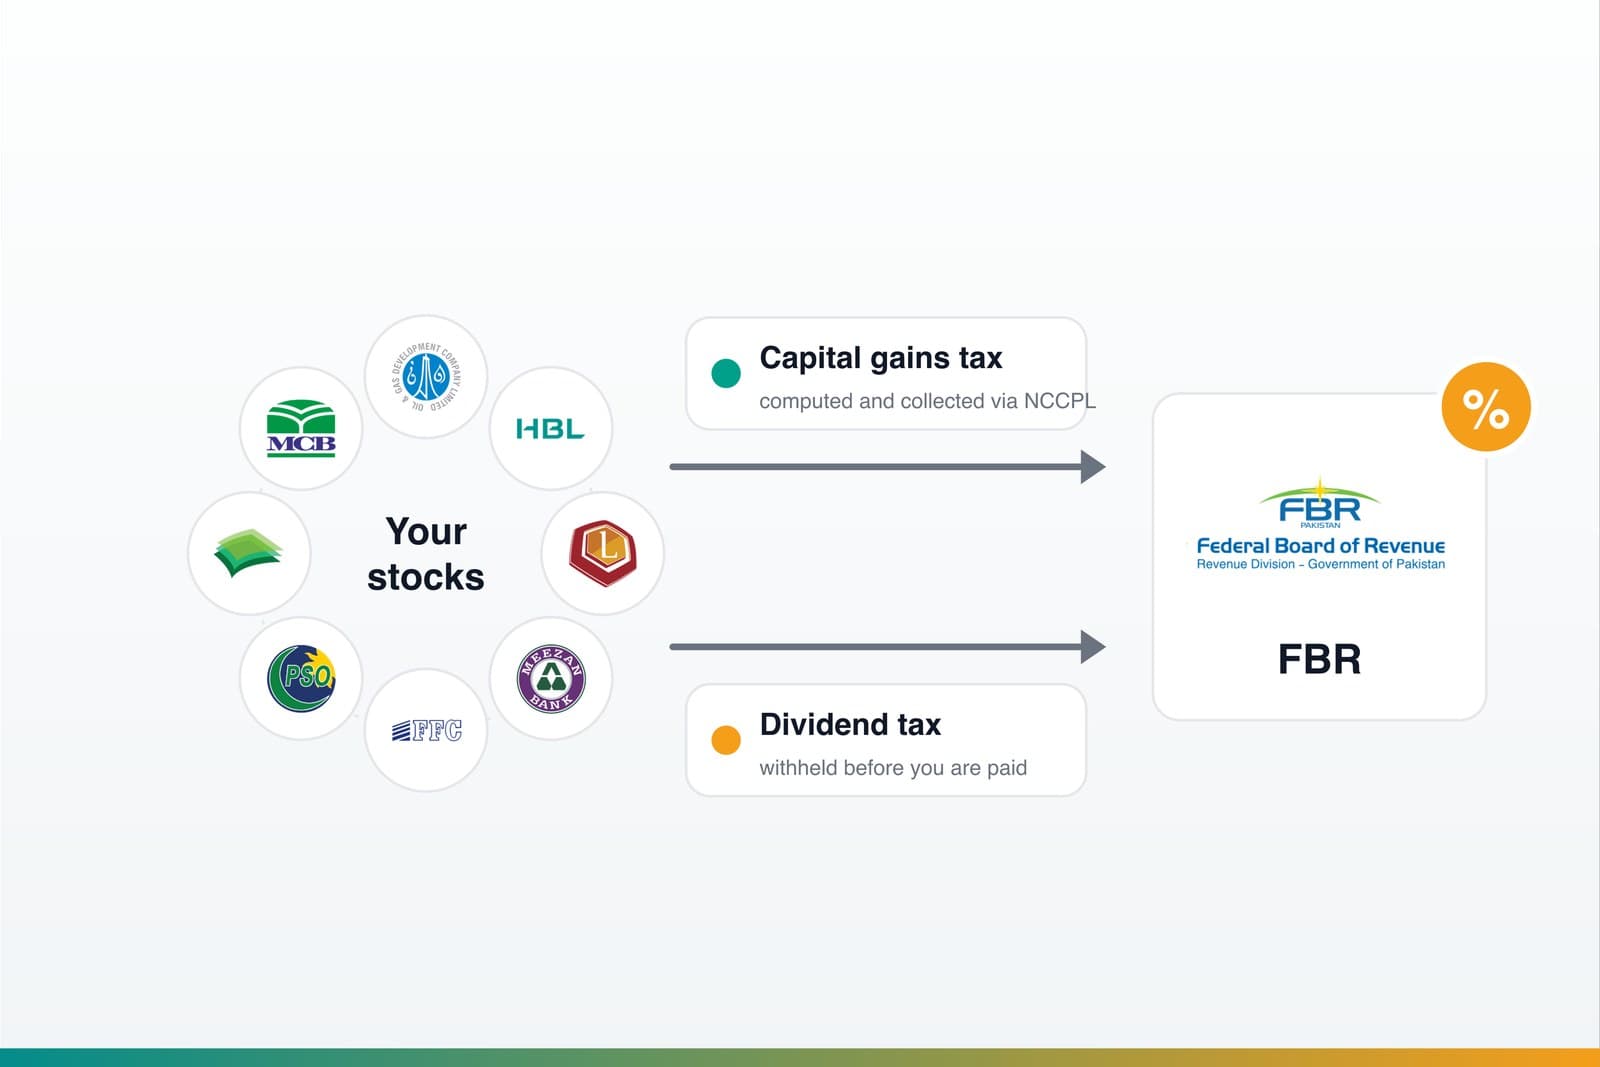
Capital Gains Tax & Dividend Tax on PSX Stocks (Pakistan)
A plain-English guide to how capital gains tax (CGT) and dividend tax work on Pakistan Stock Exchange shares - filer vs non-filer rates, how holding period and acquisition date matter, how NCCPL collects CGT, and what you still have to declare.
Read guide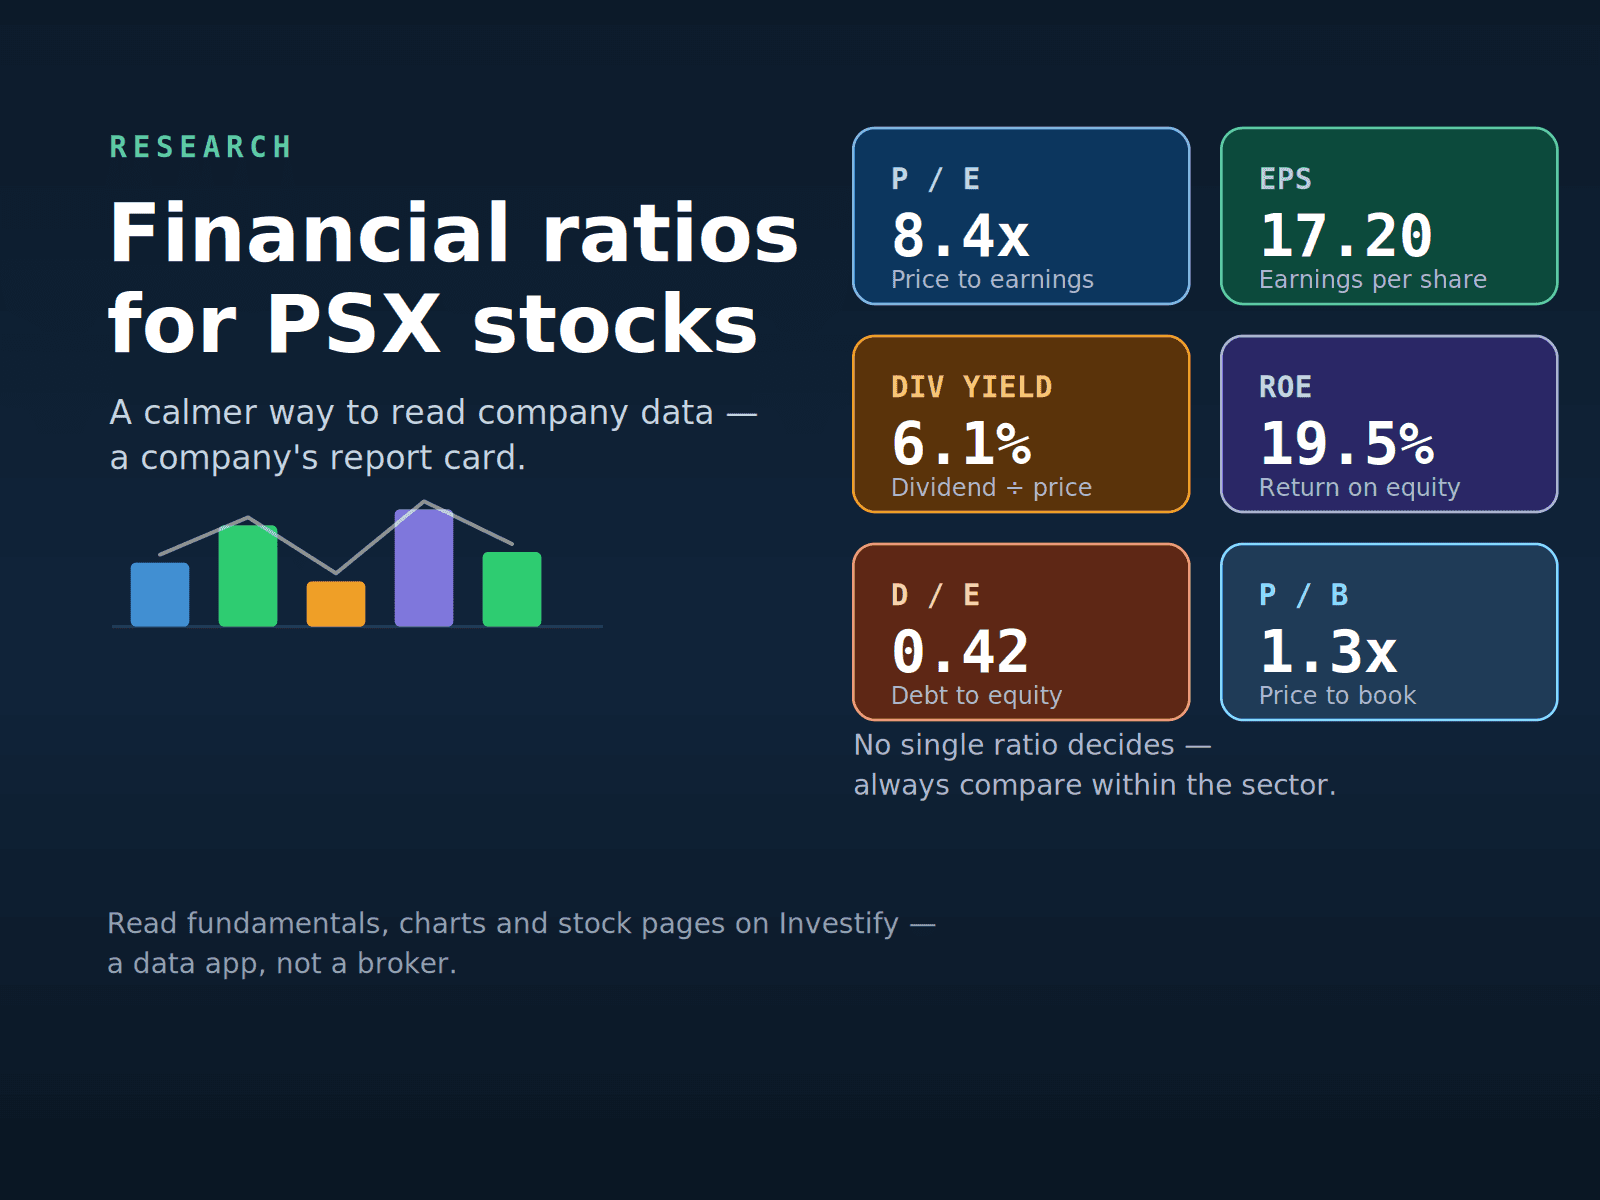
Beginner-Friendly Financial Ratios for PSX Stocks
A simple guide to key financial ratios for Pakistan Stock Exchange stocks, including EPS, P/E, dividend yield, book value, ROE, margins, debt ratios and how beginners should read them.
Read guide