
Fibonacci Retracement Calculator
THE SWING
Where a pullback or bounce might pause
Loading the 52-week range. Example numbers are shown meanwhile.
Measuring a pullback from the high.
THE PULLBACK
50% retraced
Nearest level 50% retracement at Rs 140.19, 0% above SYS at Rs 140.19.
The gold band is the 50% to 61.8% zone many traders watch most closely.
THE GOLDEN POCKET
Rs 132.12 to Rs 140.19
The 50% to 61.8% zone is where pullbacks often pause, because so many traders watch it.
SYS is inside the pocket now
IF IT BREAKS OUT
Extension targets above the high
261.8% extension
Rs 285.10
+103.4% from now
161.8% extension
Rs 216.68
+54.6% from now
127.2% extension
Rs 193.01
+37.7% from now
Extensions project beyond the swing high from the swing low.
Uptrend levels, highest first
| Level | Price | From current |
|---|---|---|
| 261.8% extension | Rs 285.10 | +103.37% |
| 161.8% extension | Rs 216.68 | +54.56% |
| 127.2% extension | Rs 193.01 | +37.68% |
| Swing high (0%) | Rs 174.40 | +24.4% |
| 23.6% retracement | Rs 158.25 | +12.88% |
| 38.2% retracement | Rs 148.26 | +5.76% |
| 50% retracement | Rs 140.19 | 0% |
| 61.8% retracement | Rs 132.12 | -5.76% |
| 78.6% retracement | Rs 120.62 | -13.96% |
| Swing low (100%) | Rs 105.98 | -24.4% |
What the levels mean
Prices rarely move in a straight line. After a strong rise they usually give back part of the gain before continuing, and after a fall they bounce part of the way back. A Fibonacci retracement marks the likely stopping points by measuring how much of the move has been given back: 23.6%, 38.2%, 50%, 61.8% and 78.6%. Many traders read a shallow pullback (23.6% to 38.2%) as a sign of a strong trend, and a pullback to 61.8% or deeper as a sign it may be weakening, though neither is a rule.
- Range
- swing high − swing low
- r
- a ratio such as 0.382 or 0.618
Extensions work the other way, past the swing, as possible targets if the trend carries on: in an uptrend, level = Low + r × Range with r above 1 (1.272, 1.618, 2.618), which puts them above the swing high.
Where the ratios come from, and why 50% is the odd one out
The ratios come from the Fibonacci sequence (1, 1, 2, 3, 5, 8, 13, 21 and so on), where each number divided by the next one tends toward 0.618, the inverse of the golden ratio φ = 1.618. The other levels are powers and roots of it. The 50% level is not a Fibonacci ratio. It is on charts because markets often retrace about half of a move, an idea older than the Fibonacci tools.
| Level | Derived as | Value |
|---|---|---|
| 61.8% | 1 ÷ φ, where φ = 1.618 (the golden ratio) | 0.618 |
| 38.2% | 1 − 0.618, which is also 0.618² | 0.382 |
| 23.6% | 0.618³ | 0.236 |
| 78.6% | √0.618 | 0.786 |
| 161.8% | φ | 1.618 |
| 127.2% | √φ | 1.272 |
| 261.8% | φ² | 2.618 |
| 50% | Half the move (Dow theory), not a Fibonacci number | 0.500 |
A worked example
A stock rises from a swing low of Rs 100 to a swing high of Rs 200, a range of Rs 100. In an uptrend the pullback levels are: 23.6% at Rs 176.40, 38.2% at Rs 161.80, 50% at Rs 150.00, 61.8% at Rs 138.20 and 78.6% at Rs 121.40. If the trend resumes, extensions sit at Rs 227.20, Rs 261.80 and Rs 361.80.
Turn it upside down: the same prices as a downtrend (high Rs 200 first, then low Rs 100) put the bounce levels above the low, with 61.8% at Rs 161.80. Extensions below the low are at Rs 72.80 and Rs 38.20; the 261.8% level would be negative, so it is dropped.
| Level | Uptrend price | Distance from the high |
|---|---|---|
| 23.6% retracement | Rs 176.40 | 11.8% below Rs 200 |
| 38.2% retracement | Rs 161.80 | 19.1% below Rs 200 |
| 50% retracement | Rs 150.00 | 25% below Rs 200 |
| 61.8% retracement | Rs 138.20 | 30.9% below Rs 200 |
| 78.6% retracement | Rs 121.40 | 39.3% below Rs 200 |
Picking the swing, and using the levels on PSX
The levels are only as good as the swing behind them. Choose a clear, recent low and high of the move you are looking at. The calculator starts from a stock's 52-week range because every stock has one and it is objective, and it reads the price history to tell whether the low or the high came first, which decides uptrend or downtrend. If a smaller recent swing is more relevant, type it in.
- Look for confluence. A retracement that lines up with an earlier high or low, a pivot from the pivot point calculator or a surge in volume is worth more than one on its own.
- Respect the daily limit. A PSX stock can move 10% either way in a day (Re. 1 for stocks under Rs 10), so a level far from the price takes several sessions. See the upper and lower lock calculator.
- Plan the exit before the entry. Put the stop just beyond the next level and aim for the swing high or an extension, then check the payoff with the risk reward calculator and size the position with the position size calculator.
A broken level is information too. A pullback that slices through 78.6% and the swing low has failed, and the old levels no longer apply. Read how to read PSX stock charts for how trends, volume and levels fit together.
Sources and assumptions
Formulas and PSX price-limit rule checked October 31, 2026.
- Investopedia: Fibonacci retracement
- Wikipedia: Fibonacci retracement
- PSX security-wise circuit breaker: 10% or Re. 1, whichever is higher (PSX notice N-477, May 20, 2024)
- 52-week high and low: Investify's PSX market feed (delayed for visitors who are signed out); ordering of the swing from Investify daily price history
Fibonacci levels are reference prices that traders watch, not predictions. A price can pass straight through any of them. Results are estimates for information and planning only, not tax, legal or investment advice. Check your own case with a tax adviser, your broker or the official source before acting.
FAQ
Fibonacci Retracement Calculator: common questions
What is a Fibonacci retracement?+
It is a set of horizontal levels between a swing high and a swing low, placed at Fibonacci ratios of the move (23.6%, 38.2%, 61.8% and 78.6%, plus the 50% level traders add by tradition). After a strong rise, traders watch those levels for where a pullback might stop, and after a fall for where a bounce might stall.
How do I calculate Fibonacci retracement levels?+
Subtract the swing low from the swing high to get the range. In an uptrend, each level is the swing high minus ratio × range. With a high of Rs 200 and a low of Rs 100, the 61.8% level is 200 − 0.618 × 100 = Rs 138.20. In a downtrend, each level is the swing low plus ratio × range, so the 61.8% bounce level is Rs 161.80.
Is 50% a Fibonacci ratio?+
No. The Fibonacci-derived ratios are 23.6%, 38.2%, 61.8% and 78.6% (powers and roots of 0.618, the inverse of the golden ratio). The 50% level comes from Dow theory's observation that markets often retrace about half of a move. Charting tools include it because traders watch it, and so does this calculator, which labels the others by their ratio.
What are Fibonacci extensions?+
Extensions are levels beyond the swing, used as possible targets when the trend continues. In an uptrend they sit above the swing high at 127.2%, 161.8% and 261.8% of the move measured from the swing low. With a low of Rs 100 and a high of Rs 200, the 161.8% extension is Rs 261.80. A switch under More options also shows 100% (a retest of the high) and 200% (the move repeated).
Which swing high and low should I use?+
Use the most recent significant swing: the clear low and high of the move you are trading, not the widest range available. The calculator defaults to a stock's 52-week high and low because they are objective and available for every stock, but a recent smaller swing is often more relevant. Edit the numbers to use your own.
Do Fibonacci levels work on PSX stocks?+
They are reference levels that many traders watch, so prices sometimes pause near them, but they are not guarantees. They work best on liquid stocks with clear trends and when they line up with other evidence such as a previous high or low, a moving average or a spike in volume. A PSX stock also cannot move beyond its daily limit (10%, or Re. 1 under Rs 10), so far-away levels take several sessions.
How do I use Fibonacci levels for a stop-loss and a target?+
A common approach is to enter near a retracement level, put the stop just beyond the next level (for example below the 78.6% level, or below the swing low), and aim for the swing high or an extension. Check the payoff with the risk reward calculator and size the trade with the position size calculator.
Keep going
Related tools
Pivot Point Calculator
Classic, Fibonacci, Camarilla, Woodie and DeMark pivots, prefilled from any PSX stock.
Risk Reward & Stop Loss Calculator
Risk to reward ratio, stop-loss and target prices, and the win rate a setup needs.
PSX Upper & Lower Lock Calculator
Today's circuit breaker limits for any PSX stock, from the previous close.
PSX guides
Learn the ideas behind the numbers
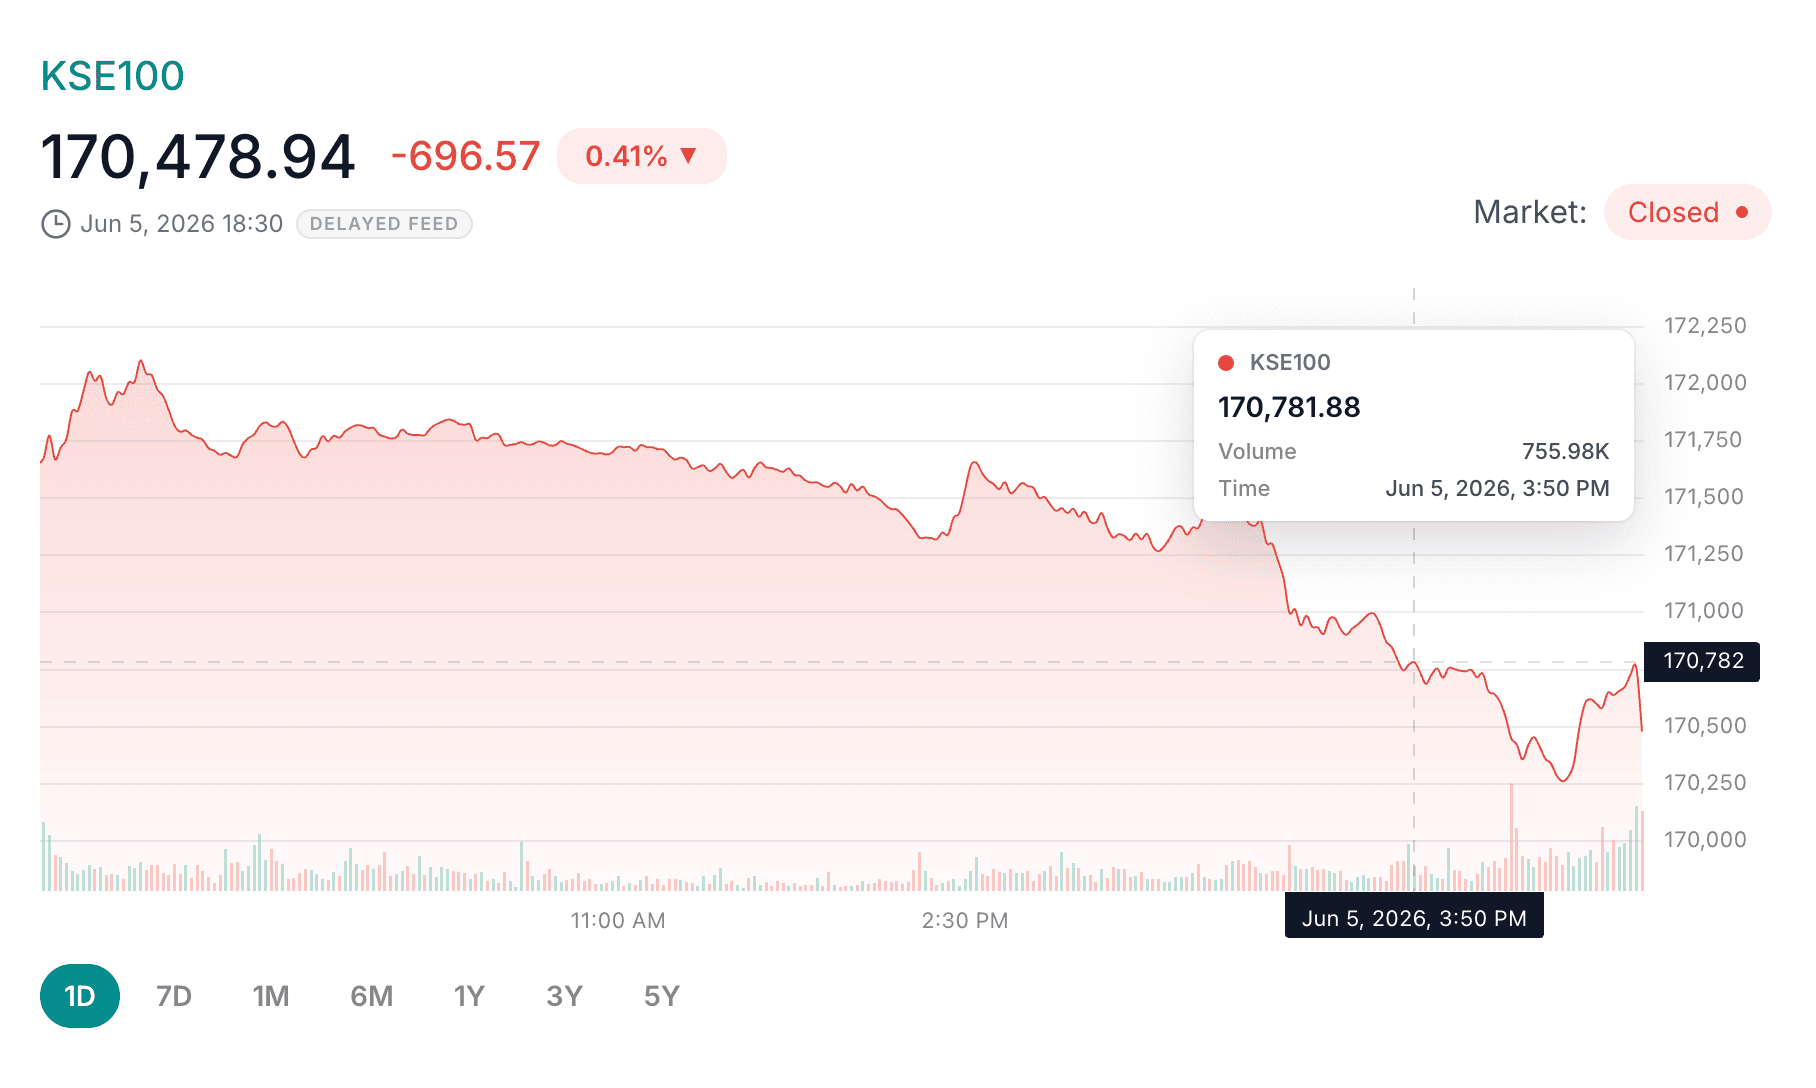
How to Read Stock Charts and Market Trends on PSX
Learn how to read PSX stock charts, price trends, volume bars, timeframes, day range and technical indicators without treating charts as guaranteed predictions.
Read guide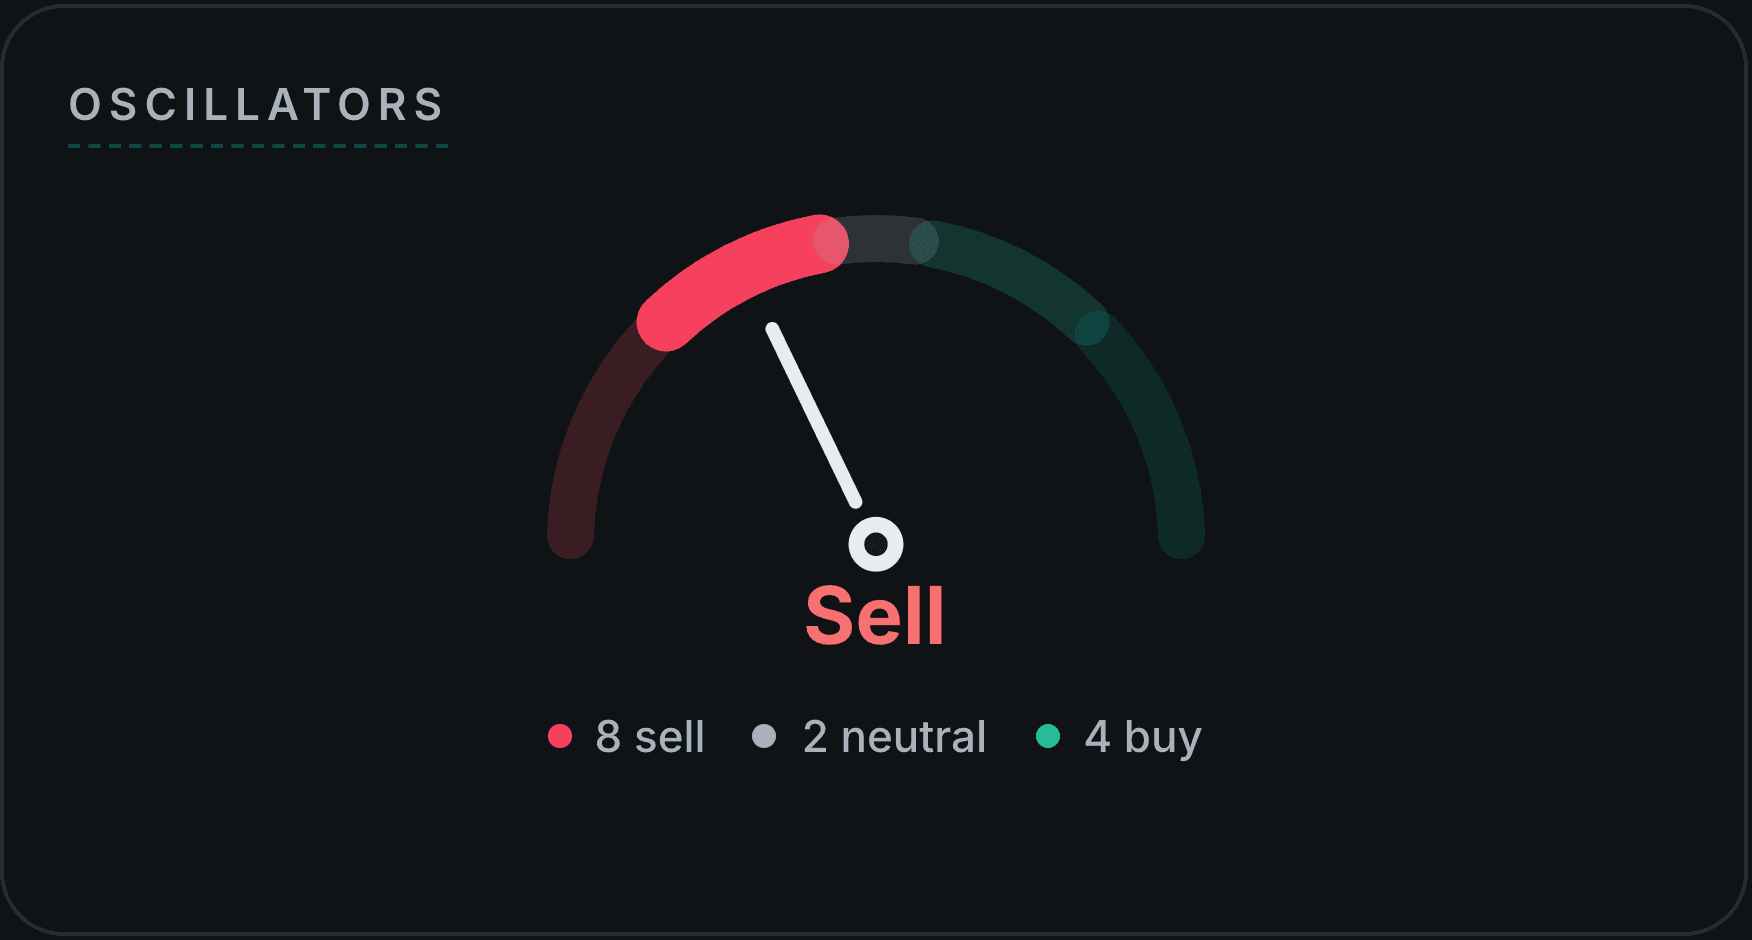
How to Read the Technicals Tab on Investify: A Beginner's Guide
A detailed, section-by-section guide to Investify's Technicals tab for PSX stocks: the buy/sell verdict gauges, Standouts, pivots and ranges, volume, every oscillator (RSI, MACD, Stochastic, ADX and more), moving averages, Bollinger Bands and ATR, all explained in plain English.
Read guide
Common Mistakes Beginners Make in the Pakistan Stock Exchange
A practical guide to common PSX beginner mistakes, including chasing tips, overtrading, ignoring risk, skipping research and not tracking portfolio decisions.
Read guide