
Inflation Calculator Pakistan
THE RUPEE OVER TIME
What old money is worth today
2010 TO SEP 2026
Rs 450,112
is what Rs 100,000 from 2010 is worth in Sep 2026.
Prices are 4.5× the 2010 level
Prices rose 9.7% a year on average over 16.2 years.
CHECK A SALARY OR A PRICE
Did it keep up since 2010?
If Rs 100,000 was your salary or a price in 2010, type what it is in Sep 2026. Inflation alone would have made it Rs 450,112.
YEAR BY YEAR
The years that ate the rupee
Pink years topped 15%, amber years 8%. Hover or tap a bar for its year.
- Needed to match Rs 100,000 from 2010
- Your Rs 100,000, unchanged
Calendar-year average CPI inflation from the World Bank (1960 to 2025) and the Pakistan Bureau of Statistics' latest national CPI (September 2026, 10.26% year on year). A year means that year's average price level, and "2026" means the September 2026 level. Your own prices will differ from the national average. To test investing against inflation, try the KSE-100 return calculator.
How the Pakistan inflation calculator works
The calculator starts from Pakistan's annual consumer price inflation, the average price level of each calendar year compared with the year before. Chaining those rates from 1960 gives a price index: the level in each year is the level in the previous year times one plus that year's inflation. The value of an amount in another year is then a ratio of two levels. The latest point is the September 2026 reading from the Pakistan Bureau of Statistics, placed on the same scale.
- P(year)
- the price level of that year, found by chaining yearly inflation
- Real return
- (1 + nominal return) ÷ (1 + inflation) − 1, the exact Fisher relation
The Future cost view grows today's cost at the rate you choose, year by year, and the Real return view compares a yearly return with either Pakistan's actual inflation between two years or a flat rate of your own.
Worked examples
Past to today. Rs 100,000 from 2010 is worth Rs 450,112 in September 2026, because prices rose 350%. Put the other way, Rs 100,000 today buys only 22% of what it bought in 2010. From 2000 the equivalent is Rs 1,036,842.
Future cost. At 10% inflation a year, something costing Rs 100,000 today costs Rs 259,374 in ten years, so savings of Rs 100,000 left in cash would buy only Rs 38,554 worth of today's goods. A quick check is the rule of 72: at 10% a year, prices double in about seven years.
Real return. Earn 14% a year for 15 years while prices rise 10% a year, and Rs 100,000 becomes Rs 713,794, which buys what Rs 170,877 bought at the start: a real return of 3.64% a year. Run your own numbers in the Real return view, and compare it with the policy rate and T-bill yields in the preset chips.
| Rs 100,000 from | Worth in September 2026 | Prices rose |
|---|---|---|
| 1990 | Rs 2,501,143 | 2401% |
| 2000 | Rs 1,036,842 | 937% |
| 2010 | Rs 450,112 | 350% |
| 2015 | Rs 309,822 | 210% |
| 2020 | Rs 224,972 | 125% |
| 2024 | Rs 116,369 | 16% |
| 2025 | Rs 112,384 | 12% |
Pakistan's inflation episodes, from the data
- 2023: 30.8%. The highest calendar-year inflation in the series since 1960. Prices rose about 77% between the 2021 and 2024 averages, so a rupee lost roughly 43% of its buying power in three years.
- 1973 to 1975: 23%, 27%, 21%. The previous peak, three years of inflation above 20%.
- 2008 to 2010: 20%, 14%, 13%. Three more years of double-digit inflation.
- 2015: 2.5%. The lowest rate since 1968 (when it was 0.2%). The only year with falling average prices in the series is 1962 (-0.5%).
- 2025: 3.5%, then rising again in 2026. Year-on-year inflation was 10.3% in September 2026, up from 5.8% in January 2026, according to the Pakistan Bureau of Statistics.
For investors this is why the return after inflation matters. A savings profit rate or a stock return that looks healthy can be small, or negative, once prices are taken out. Compare the market with the price rise in the KSE-100 return calculator, and see how a single stock did with the PSX stock return calculator.
Calendar years versus fiscal years
The Pakistan Bureau of Statistics and the State Bank headline fiscal years (July to June). We use calendar years because the World Bank publishes a consistent calendar-year series back to 1960, and a calculator should not mix two bases. The difference matters when inflation moves fast.
| Year | Calendar-year average | Fiscal-year average (July to June) |
|---|---|---|
| 2023 | 30.8% | 29.2% |
| 2024 | 12.6% | 23.4% |
| 2025 | 3.5% | 4.5% |
| 2026 | n/a (year not complete) | 7.05% |
Fiscal-year figures are from the State Bank of Pakistan (FY2023, FY2024) and the Pakistan Bureau of Statistics (FY2025, FY2026). The calculator uses the calendar-year column.
Inflation in recent months
Year-on-year change in the national CPI, from the Pakistan Bureau of Statistics. The latest month is the one the calculator treats as "2026".
| Month | Year on year | Month on month |
|---|---|---|
| October 2025 | 6.2% | +1.7% |
| November 2025 | 6.1% | +0.4% |
| December 2025 | 5.6% | -0.4% |
| January 2026 | 5.8% | +0.4% |
| February 2026 | 7.0% | +0.3% |
| March 2026 | 7.3% | +1.2% |
| April 2026 | 10.9% | +2.5% |
| May 2026 | 11.7% | +0.5% |
| June 2026 | 11.1% | -0.3% |
| July 2026 | 9.2% | +1.2% |
| August 2026 | 11.1% | +1.2% |
| September 2026 | 10.3% | +1.3% |
Pakistan CPI inflation, every year since 1960
Show the full table (World Bank, calendar-year averages)
| Year and inflation | Year and inflation | Year and inflation | |||
|---|---|---|---|---|---|
| 1960 | 6.9% | 1982 | 5.9% | 2004 | 7.4% |
| 1961 | 1.6% | 1983 | 6.4% | 2005 | 9.1% |
| 1962 | -0.5% | 1984 | 6.1% | 2006 | 7.9% |
| 1963 | 1.5% | 1985 | 5.6% | 2007 | 7.6% |
| 1964 | 4.2% | 1986 | 3.5% | 2008 | 20.3% |
| 1965 | 5.6% | 1987 | 4.7% | 2009 | 13.6% |
| 1966 | 7.2% | 1988 | 8.8% | 2010 | 12.9% |
| 1967 | 6.8% | 1989 | 7.8% | 2011 | 11.9% |
| 1968 | 0.2% | 1990 | 9.1% | 2012 | 9.7% |
| 1969 | 3.2% | 1991 | 11.8% | 2013 | 7.7% |
| 1970 | 5.3% | 1992 | 9.5% | 2014 | 7.2% |
| 1971 | 4.7% | 1993 | 10% | 2015 | 2.5% |
| 1972 | 5.2% | 1994 | 12.4% | 2016 | 3.8% |
| 1973 | 23.1% | 1995 | 12.3% | 2017 | 4.1% |
| 1974 | 26.7% | 1996 | 10.4% | 2018 | 5.1% |
| 1975 | 20.9% | 1997 | 11.4% | 2019 | 10.6% |
| 1976 | 7.2% | 1998 | 6.2% | 2020 | 9.7% |
| 1977 | 10.1% | 1999 | 4.1% | 2021 | 9.5% |
| 1978 | 6.1% | 2000 | 4.4% | 2022 | 19.9% |
| 1979 | 8.3% | 2001 | 3.1% | 2023 | 30.8% |
| 1980 | 11.9% | 2002 | 3.3% | 2024 | 12.6% |
| 1981 | 11.9% | 2003 | 2.9% | 2025 | 3.5% |
Source: World Bank indicator FP.CPI.TOTL.ZG, retrieved October 8, 2026. The first year, 1960, is the base of the price index.
Planning forward? The SIP calculator and retirement calculator let you set an inflation rate, and the lumpsum calculator shows today's-money values.
Sources and assumptions
CPI data through September 2026 (released October 1, 2026). Checked October 31, 2026.
- World Bank, World Development Indicators, Inflation consumer prices (annual %), Pakistan, calendar-year averages 1960 to 2025 (updated October 8, 2026)
- Pakistan Bureau of Statistics, press release on CPI inflation for September 2026 (national CPI, base 2015-16 = 100)
- Pakistan Bureau of Statistics, Monthly Review on Price Indices, September 2026 (monthly year-on-year inflation)
- State Bank of Pakistan, Inflation Monitor, December 2024 (fiscal-year averages for FY2023 and FY2024)
- Pakistan Bureau of Statistics, National CPI basket weights (base year 2015-16), for the food and housing weights
Inflation figures are national averages and estimates. Results are estimates for information and planning only, not tax, legal or investment advice. Check your own case with a tax adviser, your broker or the official source before acting.
FAQ
Inflation Calculator Pakistan: common questions
How do I calculate inflation between two years in Pakistan?+
Divide the price level of the later year by the price level of the earlier year and subtract one. The calculator builds a price index from Pakistan's yearly CPI inflation (each year's average over the year before), so Rs 100,000 from 2010 is worth Rs 450,112 in September 2026: prices rose 350% in between. Choose two years above and it does the multiplication for you.
What is Pakistan's inflation rate right now?+
The Pakistan Bureau of Statistics reported national CPI inflation of 10.26% for September 2026 compared with September 2025, and 1.27% higher than the month before. The average for July to September 2026 was 10.2%. The October figure is released at the start of November.
Which year had the highest inflation in Pakistan?+
In the World Bank's calendar-year series, which starts in 1960, the highest was 2023 at 30.8%. The next highest were 1973 (23.1%), 1974 (26.7%), 1975 (20.9%) in the 1970s and 2008 (20.3%). The lowest rate since 1968 was 2015, at 2.5%.
What is the difference between calendar-year and fiscal-year inflation?+
Pakistan's government reports fiscal years from July to June, while this calculator uses calendar years (January to December) so one series covers 1960 to 2025. The two differ when inflation moves quickly: calendar 2023 averaged 30.8% and fiscal 2023 (July 2022 to June 2023) averaged 29.2%, while fiscal 2024 was 23.4% and calendar 2024 only 12.6%. Both are correct for their own periods; use the calculator's years consistently.
What is real return and how do I calculate it?+
Real return is your return after inflation: (1 + nominal return) ÷ (1 + inflation) − 1. It is not just the difference between the two numbers. A 14% return while prices rise 10% a year is 3.64% a year in real terms, not 4%. Use the Real return view for your own numbers, or compare any investment with the KSE-100 return calculator.
Why is my own inflation different from the CPI figure?+
The CPI measures a national basket in which food and drink carry the largest weight (34.6% in the current basket), then housing, utilities and fuel (23.6%). If your household spends more on school fees, rent or petrol than the average, your own inflation will differ, and prices of a single item such as gold, a car or property can move very differently from the average.
How accurate is the inflation calculator?+
It is accurate for what it states: yearly average price levels from official data. A year means that year's average, and 'September 2026' is the latest monthly reading, so the answer for a start in January versus December of the same year would differ in real life but not here. Treat the figures as good estimates, not exact prices.
What inflation rate should I assume for future planning?+
Use a range rather than one number. Pakistan's average inflation since 2000 is shown as a preset, and recent years have been far above and below it. A planning rate between the long-run average and the latest reading is reasonable for a base case, with a higher and a lower case to test how sensitive your goal is.
Keep going
Related tools
KSE-100 Return Calculator
KSE-100 index returns between any two dates, annualised and against inflation.
Retirement Calculator
The savings you need to retire, and the monthly investment that gets you there.
Lumpsum Investment Calculator
The future value of a one-time investment, before and after inflation.
PSX guides
Learn the ideas behind the numbers
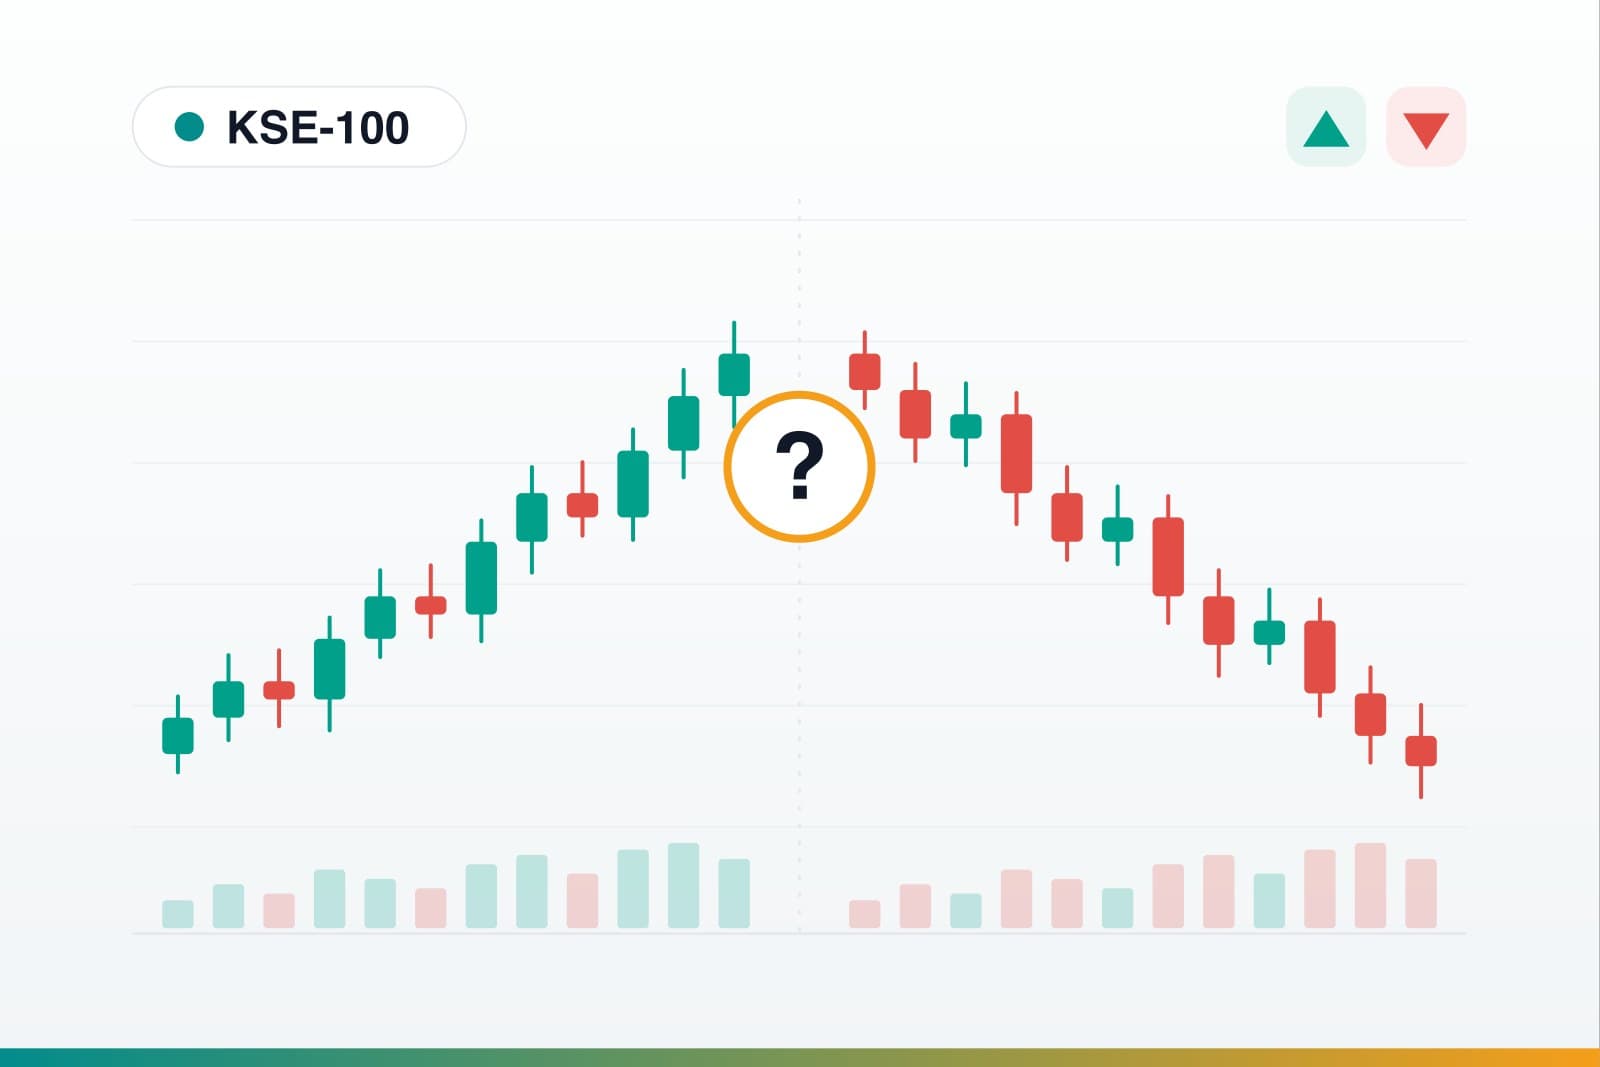
Why Is the PSX Up or Down Today? The 7 Forces That Move the KSE-100
A live look at the KSE-100 plus the seven forces that actually move the Pakistan Stock Exchange - interest rates, the rupee, politics, global shocks, results, flows and market mechanics.
Read guide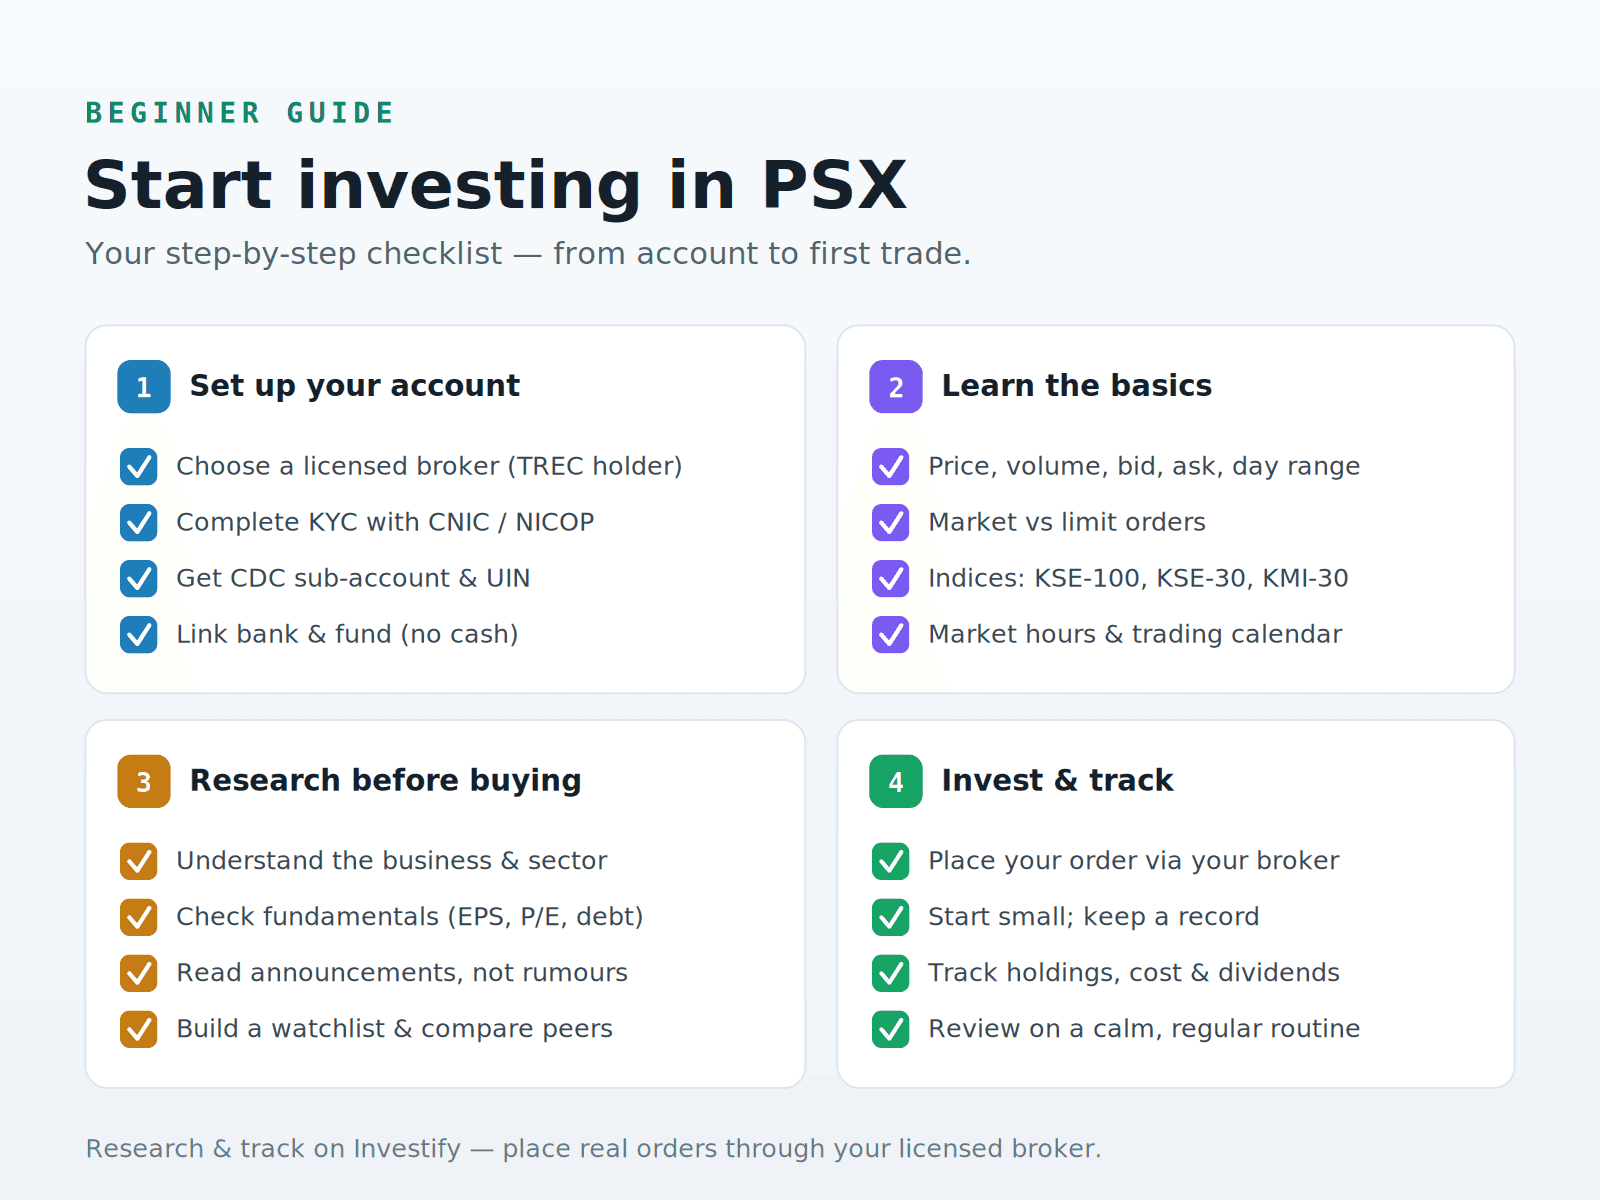
How to Start Investing in the Pakistan Stock Exchange as a Beginner
A complete beginner guide to investing in the Pakistan Stock Exchange: account setup, brokers, PSX concepts, research, risk management, portfolio tracking and daily market routines.
Read guide
Dividend Stocks vs Growth Stocks on PSX
A beginner-friendly PSX guide comparing dividend stocks and growth stocks, including risks, investor fit, sectors, interest rates and market cycles.
Read guide