
XIRR Calculator
YOUR MONEY DIARY
Every rupee in and out, with its date
This is a sample. Replace it with your own buys, sales, dividends and today's value.
- − Rs
- − Rs
- − Rs
- − Rs
- + Rs
- − Rs
- + Rs
- + Rs
YOUR REAL YEARLY RETURN
30.18%a year
You put in Rs 125,000 and got back or still hold Rs 190,200 over 1 year 10 months: +Rs 65,200.
Rs 125,000
put in
Rs 190,200
back and held
+52.2%
in total
AGAINST A SAFE RATE
You beat 11% by Rs 42,724
Values on October 30, 2026. Dividends and sales count as if they too earned the safe rate once they came back.
HOW LONG YOUR MONEY WORKED
1.6 years on average, not 1.8
+52.2%
total return on what you put in
1.6 years
the average rupee was invested
Money added later had less time to grow, so dividing the total by the whole 1 year 10 months undersells it. XIRR weighs each rupee by its own dates, the way a spreadsheet's XIRR does.
- Invested so far
- Money back and current value
XIRR is the one yearly rate that makes all your dated cash flows add up to zero, using 365-day years: the same definition spreadsheets use.
How the XIRR calculator works
XIRR (extended internal rate of return) answers: at what yearly rate would all my money have had to grow to produce exactly these cash flows on exactly these dates? Every investment counts as money going out, and every sale, dividend and the current value counts as money coming in. The calculator searches for the rate at which the two sides balance.
- CFᵢ
- each cash flow (negative for buys, positive for money received or still held)
- dᵢ
- days from the first date to that cash flow
- r
- the XIRR, as a yearly rate
There is no direct formula, so it is solved numerically: Newton's method first, and a slower but safe bisection if that fails. You do not enter signs. Choose a type for each row and the calculator makes buys negative and everything else positive.
A worked example
The sample in the calculator is a PSX investor who bought Rs 25,000 of a stock in each of five months, received two dividends and held it until October 30, 2026, when the position was worth Rs 186,000. They put in Rs 125,000 and received or hold Rs 190,200, an absolute return of +52.2%. The XIRR is 30.2% a year. These are sample numbers, not a real portfolio.
Why the timing matters
The two investors below both end with Rs 150,000 on January 1, 2026 after putting in Rs 120,000. Their absolute returns are identical. Their XIRR is not.
| How the Rs 120,000 went in | Absolute return | XIRR |
|---|---|---|
| All at once on January 1, 2025 | +25% | 25% |
| Rs 10,000 on the 1st of each month in 2025 | +25% | 48.9% |
The monthly buyer's money was invested for only about half a year on average, so earning the same total profit means the money worked much harder. That is exactly what XIRR measures and what absolute return and CAGR miss.
XIRR vs CAGR vs IRR vs absolute return
| Measure | Handles several cash flows | Uses actual dates | Best for |
|---|---|---|---|
| Absolute return | Yes (totals) | No | A quick total gain, ignoring time |
| CAGR | No (one in, one out) | Start and end only | One purchase, or comparing two values over years |
| IRR | Yes | No (assumes equal gaps) | Regular, evenly spaced cash flows |
| XIRR | Yes | Yes | Real portfolios: buys, sells and dividends on any dates |
For a single purchase, use the CAGR calculator. For a plan going forward rather than a record of what happened, see the SIP calculator.
Using XIRR with your Investify portfolio and broker statements
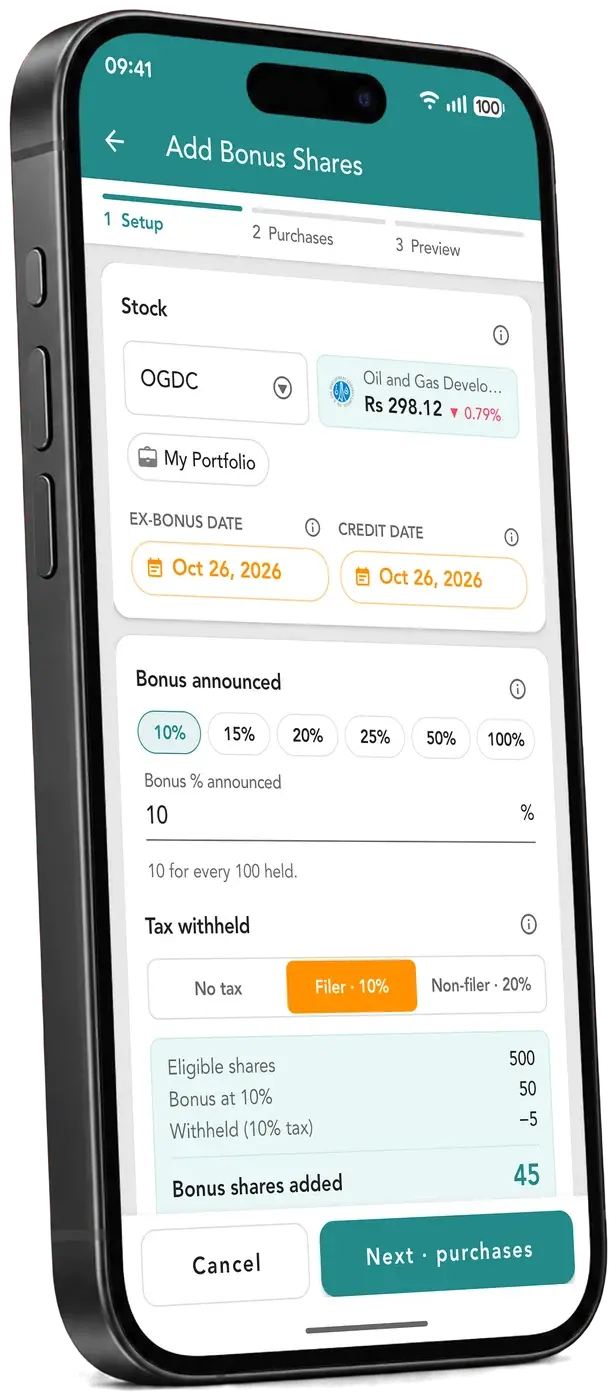
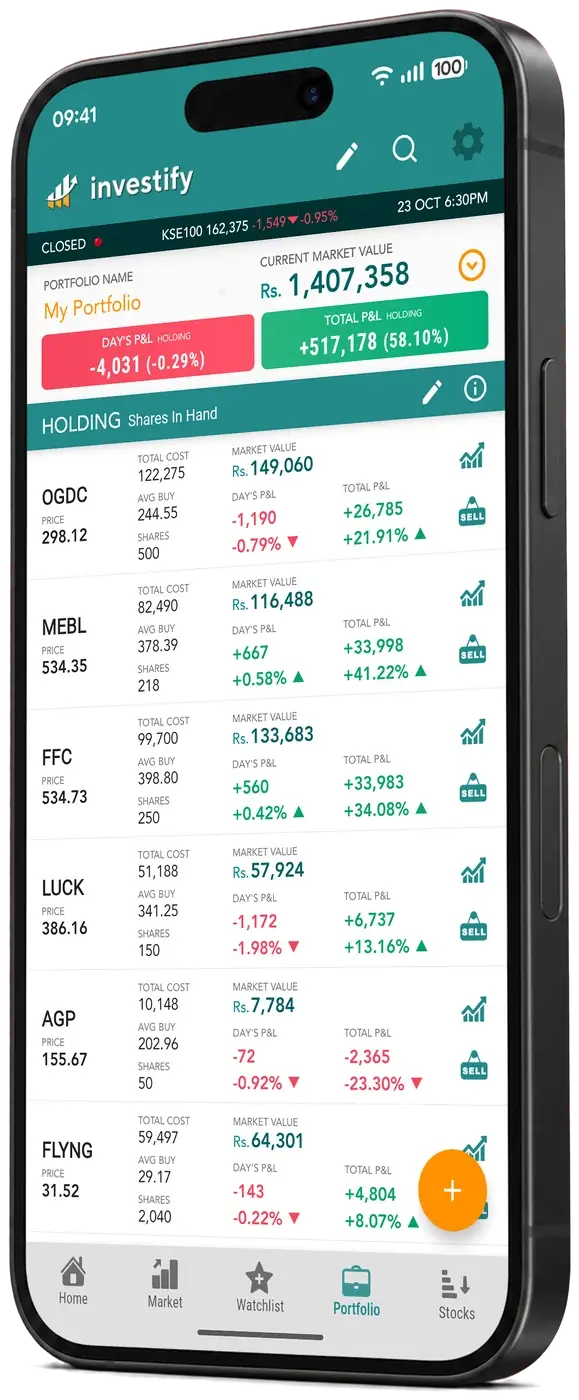
- Gather dated records. Your CDC account and broker statements give each purchase and sale with its date. Record the same buys, sells and dividends in your Investify portfolio to keep them in one place, then copy the dates and amounts for a stock into this calculator.
- Use today's value as the last row. Take the current value of that holding from your portfolio, and date it today with the Add today's value button.
- Include costs and enter dividends after tax. Put brokerage and charges inside the buy or sell amount (the brokerage calculator works them out), and enter dividends as the amount that reached your account (see the dividend tax calculator for what is withheld).
- Skip bonus shares and splits. They cost nothing and are already part of today's value. Right shares are a purchase.
- Compare with alternatives. Set a safe rate such as a bank deposit and see whether your investments beat it on the same dates. For a single stock's price history, try the PSX stock return calculator.
Limits to keep in mind
- XIRR on a holding period under a year extrapolates. A modest gain over a few weeks can look enormous when expressed per year.
- It assumes your money earned the same rate throughout. It is a summary, not a forecast.
- Cash flows that swing between money in and money out many times can in rare cases have more than one valid rate. The calculator reports the one it finds.
- Dates must be real and amounts positive. Rows with a zero amount are ignored.
Sources and assumptions
- Calculation: the annual rate r that solves Σ cash flow ÷ (1 + r)^(days ÷ 365) = 0, solved with Newton's method and a bisection fallback
- Matches the spreadsheet XIRR definition (actual dates, 365-day year, first date as the starting point)
- Pakistan Stock Exchange: price and dividend history to fill in your own rows
- Central Depository Company: CDC account statements for dated buys and sells
Results are estimates for information and planning only, not tax, legal or investment advice. Check your own case with a tax adviser, your broker or the official source before acting.
FAQ
XIRR Calculator: common questions
What is XIRR?+
XIRR is the annualised return of an investment where money went in and came out on different dates. It finds the single yearly rate that makes the present value of all your cash flows equal zero, weighting each rupee by how long it was actually invested. It is the right way to measure SIPs, repeated share purchases, dividends and part-sales.
How is XIRR different from CAGR?+
CAGR needs exactly one amount in and one value out. XIRR handles any number of dated flows. If you invest once and check the value later, XIRR equals CAGR. If you invest in instalments, CAGR would treat all the money as if it had been invested on the first day. In the example above, Rs 120,000 bought in one go and Rs 120,000 bought in twelve monthly instalments both end at Rs 150,000, but the lump sum returned 25% a year and the instalments 48.9%, because most instalments were invested for much less than a year.
How do I calculate XIRR in Excel or Google Sheets?+
Put your dates in one column and your cash flows in another, with investments as negative numbers and money received as positive, then use =XIRR(values, dates). The calculator above does the same and handles the signs for you: enter every amount as a positive number and choose whether it is a buy, a sale, a dividend or the current value.
Why does my XIRR differ from my absolute return?+
Absolute return ignores time. Both examples above show a 25% total return (+25%), but the yearly rates are very different. XIRR also counts the timing of dividends and partial sales, so a dividend received early raises it more than the same dividend received late.
What should I enter as the current value?+
Enter what the shares or units you still hold are worth today, as one row of type Current value dated today. Do not add it twice if you also record a sale of the same holding. If you sold everything, you do not need a current value: the sale proceeds are the final cash flow.
How do I handle bonus shares, splits and right shares?+
Bonus shares and splits cost nothing and are already inside today's value, so do not enter them as buys. Right shares are a purchase: enter the amount you paid on the date you paid it. Dividends should be entered after tax, as the amount that reached your account. Brokerage and other charges belong in the buy or sell amount.
Why does the calculator say there is no solution?+
XIRR needs at least one investment and at least one amount received or held, on at least two different dates. It can also fail when the period is only a few days and the gain is large, because the annualised figure becomes astronomically big: a doubling in a single day would annualise to a number with more than a hundred digits. Anything above 1,000,000% a year is treated as no solution. In those cases use the absolute return instead.
Keep going
Related tools
CAGR Calculator
Compound annual growth rate between two values, and the value a target CAGR gives.
PSX Stock Return Calculator
What an investment in any PSX stock would be worth today, from real price history.
SIP Calculator
What a fixed monthly investment in PSX stocks or mutual funds can grow to, with yearly step-up.
PSX guides
Learn the ideas behind the numbers
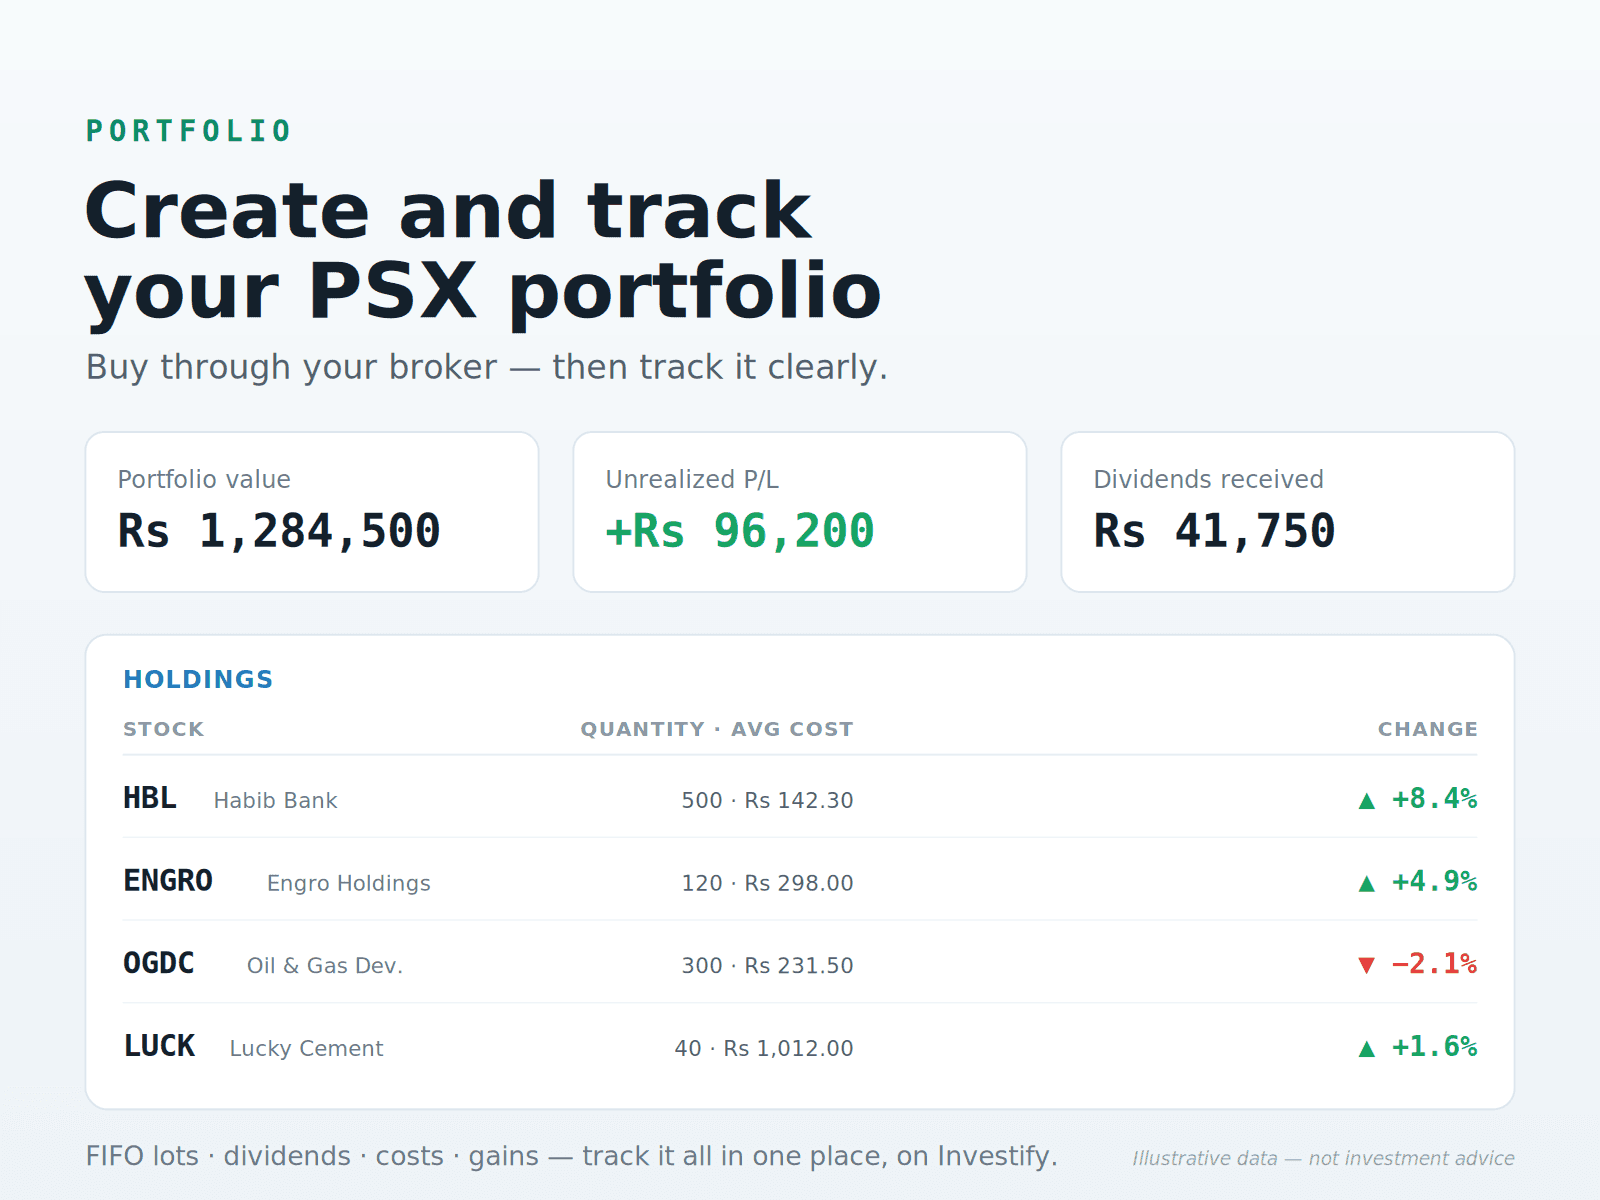
How to Create and Track a PSX Stock Portfolio
Learn how to create a PSX stock portfolio through a licensed broker and track it with FIFO, dividends, costs and corporate actions.
Read guide
Dividend Stocks vs Growth Stocks on PSX
A beginner-friendly PSX guide comparing dividend stocks and growth stocks, including risks, investor fit, sectors, interest rates and market cycles.
Read guide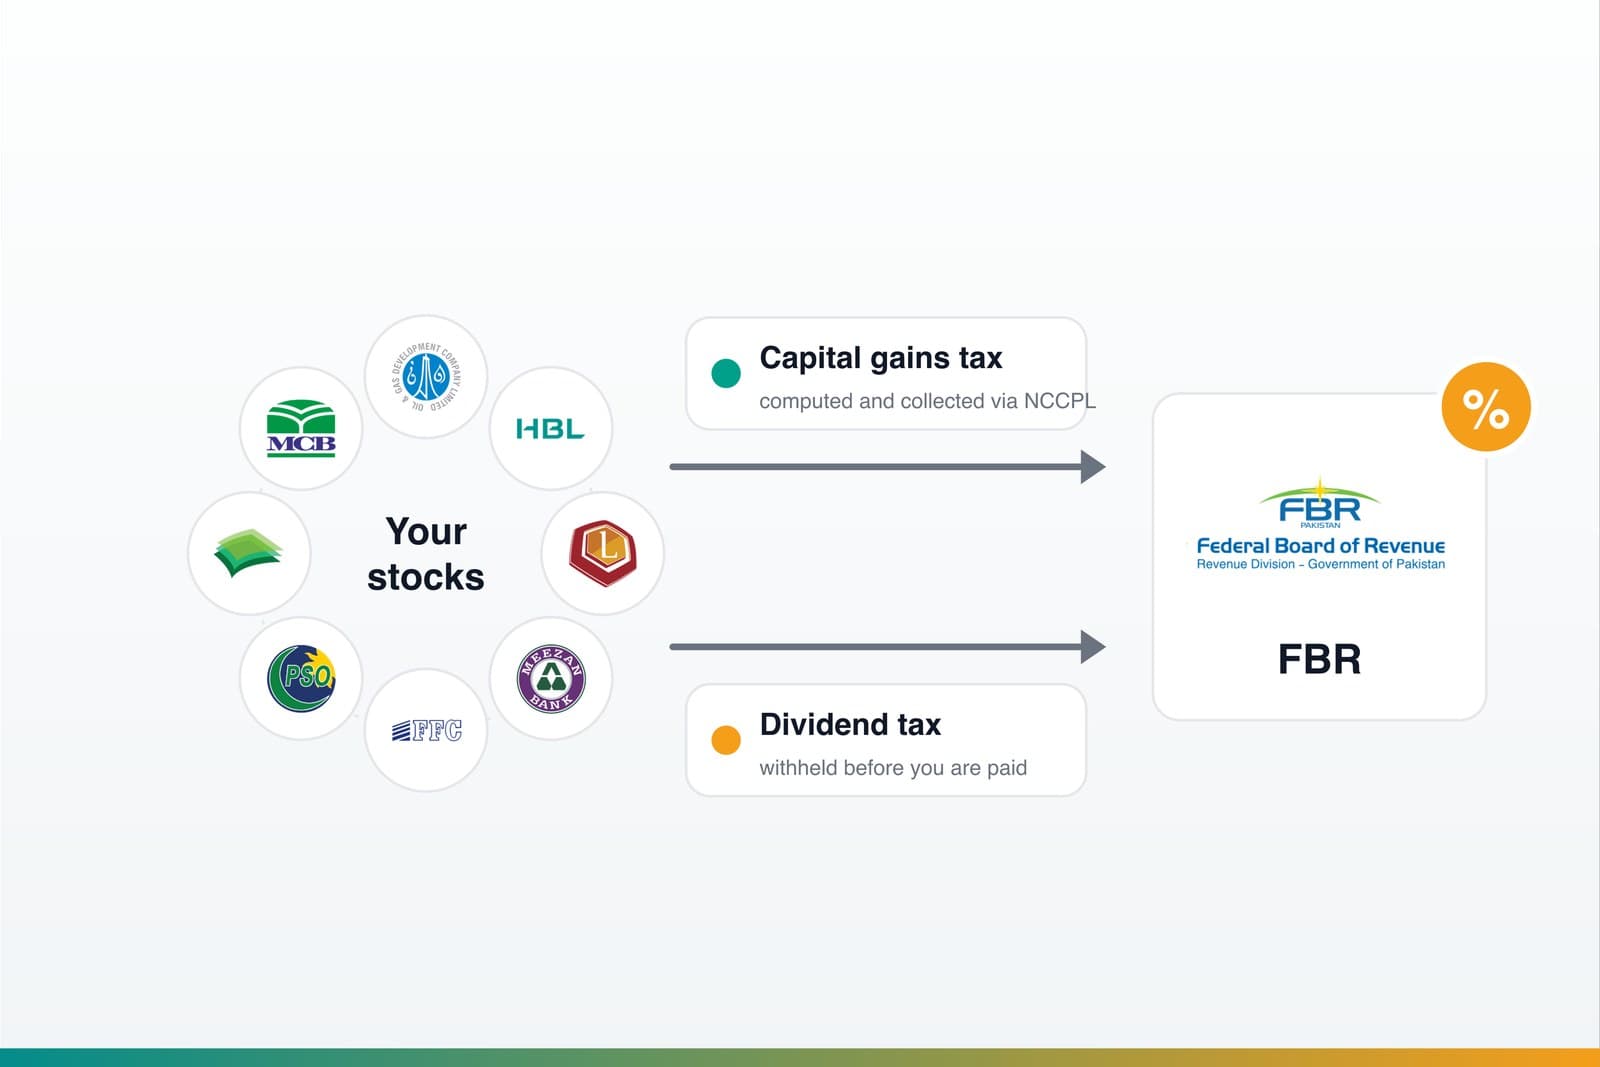
Capital Gains Tax & Dividend Tax on PSX Stocks (Pakistan)
A plain-English guide to how capital gains tax (CGT) and dividend tax work on Pakistan Stock Exchange shares - filer vs non-filer rates, how holding period and acquisition date matter, how NCCPL collects CGT, and what you still have to declare.
Read guide