
KSE-100 Return Calculator
THE TIME MACHINE
What if you had bought the index back then?
Travel back to
History starts in November 2021. A holiday moves to the next session. Price index: dividends are not included.
Results
Loading KSE-100 price history...
How the KSE-100 return calculator works
The calculator reads the daily closing level of the index you choose. Your start date moves forward to the first trading session on or after it, and your end date moves back to the last session on or before it. From those two closes it works out the points change, the total return and, for periods of a year or more, the compound annual growth rate (CAGR). The calendar year table splits the same period into years, using the previous year's last close as each year's starting point.
- Total return
- end level ÷ start level − 1
- CAGR
- (end level ÷ start level)^(1 ÷ years) − 1, with years counted in actual days ÷ 365.25
- Real return
- (1 + total return) ÷ (1 + inflation over the same dates) − 1
In the monthly option the same amount is invested on the first trading day of each month and the plan's annualised return is its XIRR. For a stock-by-stock version of this tool, see the PSX stock return calculator.
A worked example
Suppose an index moves from 50,000 on November 1, 2021 to 125,000 on November 1, 2026 (made-up levels, to show the arithmetic). That is a points change of 75,000, a total return of +150% and a CAGR of 20.1% a year. Rs 100,000 invested at the start would be worth Rs 250,000.
Now suppose prices in Pakistan doubled over the same five years. The real return is (1 + 150%) ÷ (1 + 100%) − 1 = 25%, so in buying power the investment gained 25%, not 150%. Use the inflation calculator for the price side of that comparison.
| Measure | Example |
|---|---|
| Start and end level | 50,000 to 125,000 |
| Total return | +150% |
| CAGR (5 years) | 20.1% |
| Inflation over the period (assumed) | +100% |
| Real return | +25% |
A price index, not a total return index
The KSE-100 follows share prices. It does not add back the cash dividends the 100 companies paid, so the index return understates what an investor who owned all of them actually earned. We do not have a verified total return series for the KSE-100, so we do not invent one: the figures here are price returns only, and the page says so wherever it shows a result.
That matters most when you compare the market with other choices. A savings certificate or a bank deposit pays its profit in cash, so comparing it with a price-only index is a little unfair to the index. Check the alternatives side by side with the National Savings calculator and the compound interest calculator, and estimate dividends separately with the dividend income calculator.
Reading the numbers sensibly
- Start and end dates change the answer a lot. A stock market return that looks spectacular from one low can look ordinary from another. Look at the calendar year table and try a few start dates.
- The worst fall is the real risk figure. The biggest fall from a peak tells you how much of your money was, at one point, gone on paper. Ask yourself whether you would have held on.
- A monthly plan smooths the entry price. It invests through the highs and the lows, so its result depends less on one date. Compare it with the one-time result for the same period.
- Real return is the one that buys things. Pakistani inflation reached double digits in several recent years, so the gap between nominal and real returns is large.
To project forward rather than look back, use the SIP calculator or the CAGR calculator. For the basics of each index, read the guide to the KSE-100, KSE-30 and KMI-30.
Sources and assumptions
Method and data window reviewed October 31, 2026.
- Daily index closing levels from Pakistan Stock Exchange market data via Investify, from November 2021
- Inflation before January 2024: World Bank, Inflation, consumer prices (annual %), Pakistan, calendar-year averages
- Inflation from January 2024 to September 2026: Pakistan Bureau of Statistics, monthly national CPI (2015-16 = 100)
Index returns are price returns without dividends or costs. Results are estimates for information and planning only, not tax, legal or investment advice. Check your own case with a tax adviser, your broker or the official source before acting.
FAQ
KSE-100 Return Calculator: common questions
How do I calculate the KSE-100 return between two dates?+
Divide the index level on the end date by the level on the start date and subtract one. If the KSE-100 was 50,000 and is now 125,000, the total return is 150%. This calculator reads the daily closing levels, moves each date to the nearest trading session, and also works out the annualised return (CAGR), the points change, the worst fall and the return by calendar year.
Does the KSE-100 return include dividends?+
No. The KSE-100 is a price index, so it follows share prices only. Investors who owned the companies also received cash dividends, which made their actual return higher than the index return. We do not show a total return series because we do not have a verified one, so treat the figures as the price return of the market.
What is the KSE-100's annualised return (CAGR)?+
CAGR is the steady yearly growth rate that would take the index from its starting level to its ending level over your period: (end level ÷ start level)^(1 ÷ years) − 1. It smooths out the big ups and downs. The calculator shows it only for periods of about a year or more, because annualising a few months is misleading.
What is the inflation-adjusted (real) return?+
The real return strips out rising prices: (1 + index return) ÷ (1 + inflation over the same dates) − 1. If the index doubles while prices also double, your real return is zero. Inflation uses Pakistan CPI: monthly readings from the Pakistan Bureau of Statistics from January 2024 to September 2026 (later dates are estimated at the latest year-on-year pace) and World Bank yearly averages before that. The real return is therefore an approximation: usually a few percentage points either way, and more for periods under two years that start before January 2024.
Can I invest in the KSE-100 directly?+
You cannot buy an index itself. You can buy shares of the companies in it, or units of an index fund or exchange-traded fund that follows an index, which charges a management fee. The cost field under More options is a percentage charged on each purchase, such as brokerage or a sales load, so you can see how much that would take off the result. A yearly management fee is not modelled: held for several years, it would take more than a one-off cost of the same size.
What is the difference between the KSE-100, KSE-30, KMI-30 and the All Share index?+
The KSE-100 tracks 100 companies chosen for sector representation and market capitalisation, and the KSE-30 is a free-float, liquidity-screened set of 30 large companies. The KMI-30 and KMI All Share are the Shariah-compliant indices, and the All Share index covers all eligible companies. Different baskets give different returns over the same dates, which you can check by switching the index or using the compare option.
How far back does the index history go?+
The daily history on Investify starts in November 2021. For earlier periods you need an exchange or financial-data source; we only show returns we can calculate from verified daily levels.
What does the monthly option calculate?+
It invests the same rupee amount on the first trading day of every month, like a systematic investment plan, and values everything at your end date. Its annualised return is the XIRR, which weighs each payment by how long it was invested, and its real return measures each month's money from its own purchase date. It shows how a steady plan fared through the ups and downs compared with a one-time investment.
Keep going
Related tools
PSX Stock Return Calculator
What an investment in any PSX stock would be worth today, from real price history.
Inflation Calculator Pakistan
What rupees from any year are worth today, from Pakistan's CPI history.
CAGR Calculator
Compound annual growth rate between two values, and the value a target CAGR gives.
PSX guides
Learn the ideas behind the numbers
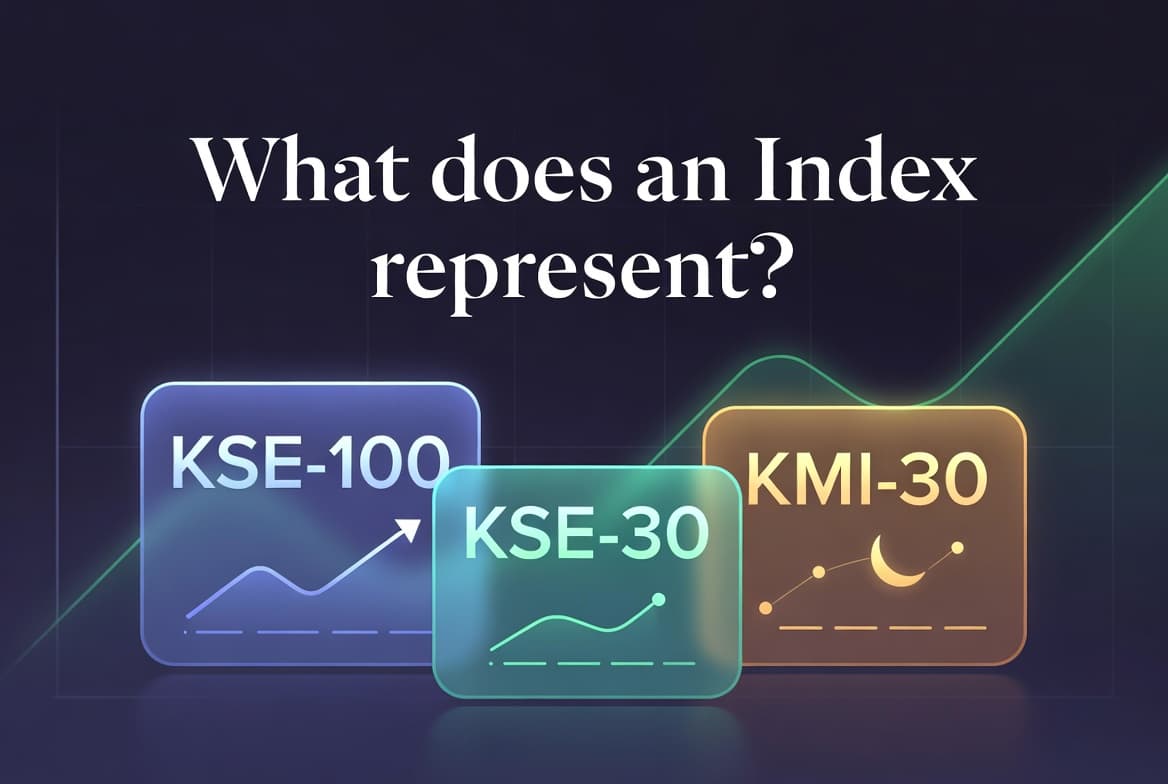
KSE100, KSE30 and KMI30 Explained for Beginners
Learn what KSE100, KSE30, KMI30 and other Pakistan Stock Exchange indices mean, how they differ, and how beginners can use them to understand PSX market movement.
Read guide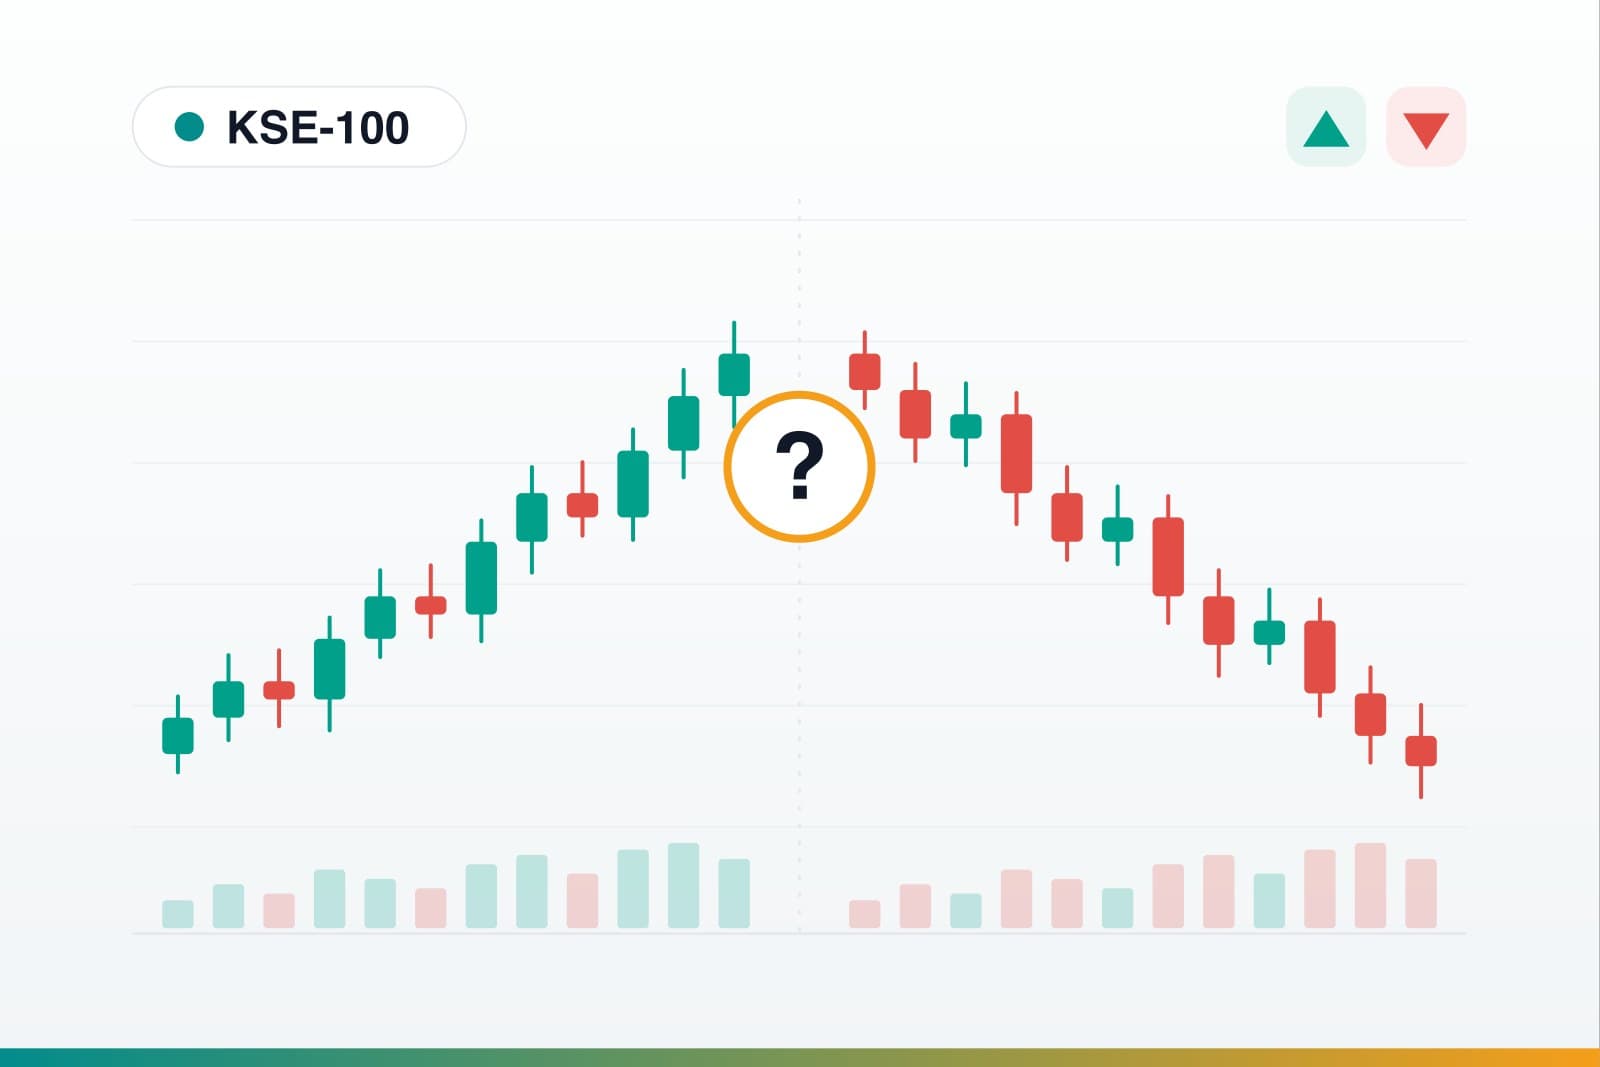
Why Is the PSX Up or Down Today? The 7 Forces That Move the KSE-100
A live look at the KSE-100 plus the seven forces that actually move the Pakistan Stock Exchange - interest rates, the rupee, politics, global shocks, results, flows and market mechanics.
Read guide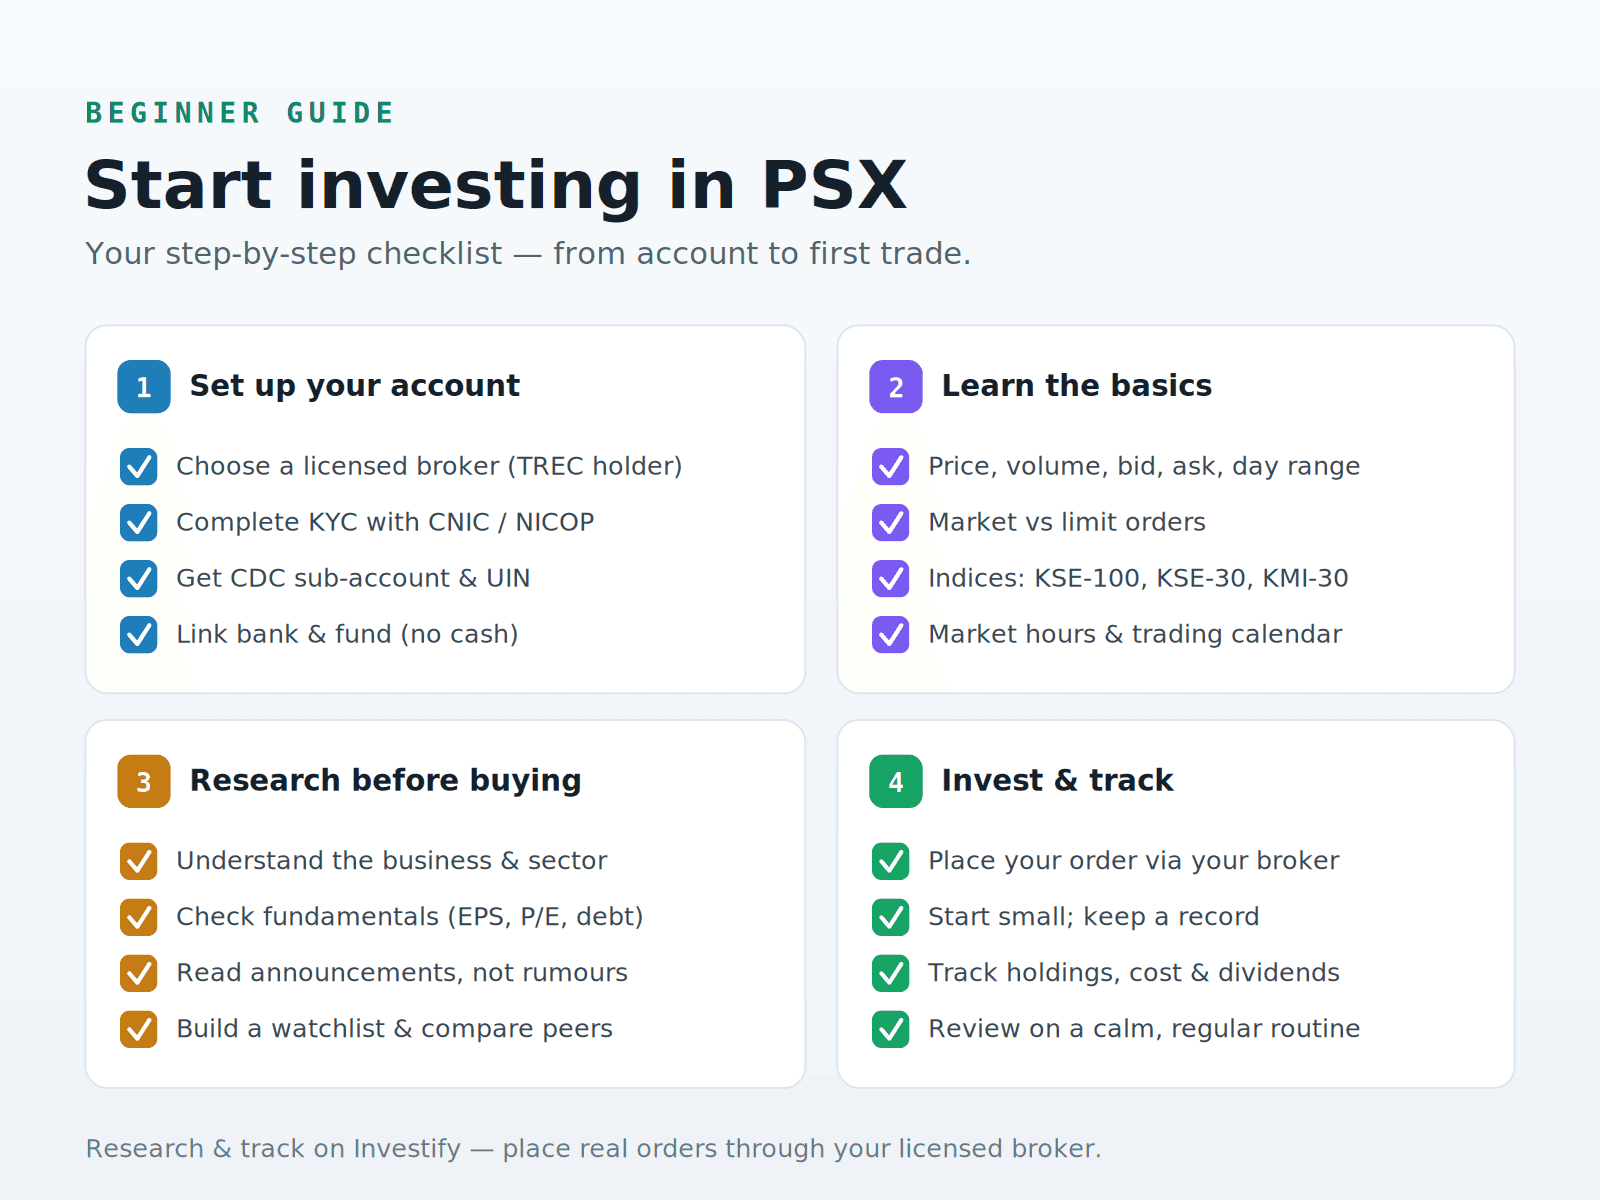
How to Start Investing in the Pakistan Stock Exchange as a Beginner
A complete beginner guide to investing in the Pakistan Stock Exchange: account setup, brokers, PSX concepts, research, risk management, portfolio tracking and daily market routines.
Read guide