
Pivot Point Calculator
THE SESSION
Tomorrow's levels from today's range
Loading the stock's price history. Example numbers are shown meanwhile.
Method
The original method. The pivot P is the average of the high, low and close. R1 and S1 mirror P around the previous low and high, R2 and S2 add and subtract the whole range, and R3 and S3 stretch further.
CLASSIC PIVOTS
Between S1 and Pivot (P)
Next level up: Pivot (P) at Rs 307.72 (+0.3%), next level down: S1 at Rs 305.06 (-0.6%).
- R3resistance+2.3%Rs 313.84
- R2resistance+1.7%Rs 312.11
- R1resistance+0.9%Rs 309.45
- Pivot (P)+0.3%Rs 307.72
- OGDC NOWRs 306.78
- S1support-0.6%Rs 305.06
- S2support-1.1%Rs 303.33
- S3support-2%Rs 300.67
Pivot P is Rs 307.72; the price is below it by 0.31%. Levels are reference prices many traders watch, not predictions.
EVERY METHOD
Five ways to draw the same session
Pivot, support and resistance by method
| Method | S3 | S2 | S1 | P | R1 | R2 | R3 |
|---|---|---|---|---|---|---|---|
| Classic | 300.67 | 303.33 | 305.06 | 307.72 | 309.45 | 312.11 | 313.84 |
| Fibonacci | 303.33 | 305.01 | 306.05 | 307.72 | 309.40 | 310.44 | 312.11 |
| Camarilla | 305.57 | 305.98 | 306.38 | 307.72 | 307.18 | 307.58 | 307.99 |
| Woodie | 300.19 | 303.10 | 304.58 | 307.49 | 308.97 | 311.88 | 313.36 |
| DeMark | — | — | 306.39 | 308.39 | 310.78 | — | — |
Camarilla and Woodie also have R4 and S4, and DeMark has only R1, P and S1.
Classic levels for the next session
| Level | Price | From current |
|---|---|---|
| R3 | Rs 313.84 | +2.3% |
| R2 | Rs 312.11 | +1.74% |
| R1 | Rs 309.45 | +0.87% |
| Pivot (P) | Rs 307.72 | +0.31% |
| S1 | Rs 305.06 | -0.56% |
| S2 | Rs 303.33 | -1.12% |
| S3 | Rs 300.67 | -1.99% |
What pivot points are and how they are used
A pivot point is a price worked out from the last finished session that acts as a balance point for the next one. Above it, buyers had the upper hand in the last session's average; below it, sellers did. Around it sit resistance levels (R1, R2, R3) where a rising price often stalls and support levels (S1, S2, S3) where a falling price often pauses.
Because every trader can calculate the same numbers from the same high, low and close, the levels become a shared reference. That is the whole reason they work when they do: not magic, just many people looking at the same prices. Use them to choose entries, to place stops just beyond a level (the position size calculator turns a stop into a share count), and to pick targets for the risk reward calculator.
- H, L, C
- high, low and close of the last completed session
- Range
- H − L
The five methods
| Method | Pivot | Levels |
|---|---|---|
| Classic | (H + L + C) ÷ 3 | R1 = 2P − L, R2 = P + Range, R3 = H + 2(P − L); mirrored for supports |
| Fibonacci | (H + L + C) ÷ 3 | P ± 0.382 × Range, P ± 0.618 × Range, P ± 1.000 × Range |
| Camarilla | (H + L + C) ÷ 3 | C ± 1.1 × Range ÷ 12, ÷ 6, ÷ 4, ÷ 2 (four levels each side) |
| Woodie | (H + L + 2C) ÷ 4 | R1 = 2P − L, R2 = P + Range, R3 = H + 2(P − L), R4 = R3 + Range; mirrored |
| DeMark | X ÷ 4, where X depends on close against open | R1 = X ÷ 2 − L, S1 = X ÷ 2 − H (one pair only) |
For DeMark, X = H + 2L + C if the close is below the open, 2H + L + C if it is above, and H + L + 2C if they are equal. Every other method ignores the open.
A worked example
Say a stock's last session opened at Rs 305, reached a high of Rs 312 and a low of Rs 304, and closed at Rs 308. The range is Rs 8. Classic pivots give a pivot of Rs 308.00, resistance at Rs 312.00, Rs 316.00 and Rs 320.00, and support at Rs 304.00, Rs 300.00 and Rs 296.00.
| Method | S2 | S1 | P | R1 | R2 |
|---|---|---|---|---|---|
| Classic | 300.00 | 304.00 | 308.00 | 312.00 | 316.00 |
| Fibonacci | 303.06 | 304.94 | 308.00 | 311.06 | 312.94 |
| Camarilla | 306.53 | 307.27 | 308.00 | 308.73 | 309.47 |
| Woodie | 300.00 | 304.00 | 308.00 | 312.00 | 316.00 |
| DeMark | — | 306.00 | 309.00 | 314.00 | — |
Notice how tightly Camarilla packs its levels around the close compared with the other methods, and that DeMark offers only one support and one resistance.
Which session to use, and what PSX adds
Pivots are built from a completed session. Early in the PSX day the high and low are only a few hours old and keep changing, so a pivot from them is meaningless by lunchtime. The calculator therefore uses the last full daily bar from Investify's price history, shows its date, and lets you switch to today's session so far or type your own numbers. On weekends and holidays the last completed session is simply the last trading day.
- Daily limits cap the ladder. A PSX stock can move 10% either way in a day (or Re. 1 for stocks under Rs 10). A stock closing at Rs 308 can trade no higher than Rs 338.80 or lower than Rs 277.20 next session, so a level beyond those prices cannot be reached that day. Check them with the upper and lower lock calculator.
- Corporate actions. After a bonus, split or rights issue, older prices are adjusted. The calculator uses adjusted history, so levels line up with today's price.
- Liquidity matters. Levels work best on actively traded stocks. A stock that trades a few thousand shares a day does not respect them.
Pivots look at one day. To map a bigger swing, use the Fibonacci calculator, and read how to read PSX stock charts for the wider picture.
Sources and assumptions
Formulas and PSX price-limit rule checked October 31, 2026.
- StockCharts ChartSchool: pivot points (floor trader, Woodie, Camarilla, DeMark, Fibonacci)
- Investopedia: pivot point
- PSX security-wise circuit breaker: 10% or Re. 1, whichever is higher (PSX notice N-477, May 20, 2024)
- Prices: Investify daily history (adjusted for bonus issues, splits and rights issues, not for cash dividends) and Investify's PSX market feed (delayed for visitors who are signed out)
Pivot points are widely used reference prices, not forecasts. Prices can and often do move straight through them. Results are estimates for information and planning only, not tax, legal or investment advice. Check your own case with a tax adviser, your broker or the official source before acting.
FAQ
Pivot Point Calculator: common questions
What are pivot points?+
Pivot points are reference prices worked out from one finished session's high, low and close. The pivot (P) is the average of those three prices, and support (S) and resistance (R) levels are placed above and below it. Traders watch them because they are simple, objective and widely shared, so many believe prices tend to pause or reverse near them, though they often do not.
How do you calculate pivot points?+
For classic pivots: P = (high + low + close) ÷ 3, R1 = 2P − low, S1 = 2P − high, R2 = P + (high − low), S2 = P − (high − low), R3 = high + 2 × (P − low) and S3 = low − 2 × (high − P). Fibonacci, Camarilla, Woodie and DeMark pivots use different multipliers or weights. The calculator shows every method with the formulas it uses.
Which session should I use for pivot points?+
A completed one. Pivot points project levels for the next session from the last full one, so by default the calculator uses the last completed daily bar. Using today's high and low while the market is open gives levels that keep moving as the day goes on; you can still switch to today's session so far if you want to see that.
Which pivot point method is best?+
None is better in general. Classic is among the most widely used, so it is a reasonable default. Fibonacci pivots space levels by Fibonacci ratios, Camarilla packs levels closely around the close for intraday reversals, Woodie leans more on the close, and DeMark depends on the open. Try the method your chart platform uses, so you are looking at the same levels as other traders.
Do pivot points work on PSX stocks?+
They can, with two cautions. Thinly traded stocks do not respect levels as cleanly as liquid blue chips, and a PSX stock cannot move more than its daily limit (10%, or Re. 1 for stocks under Rs 10), so a level beyond today's upper or lower lock cannot be reached that session. Use them as reference points alongside volume and the trend, not as signals on their own.
Why does DeMark need the opening price?+
DeMark pivots weight the high, low and close differently depending on whether the session closed below its open, above it, or exactly at it. A close below the open uses X = high + 2 × low + close, a close above uses X = 2 × high + low + close, and an equal close uses X = high + low + 2 × close. The pivot is X ÷ 4.
Are the historical prices adjusted for bonus shares and splits?+
Yes. Investify's daily price history is adjusted for bonus issues, splits and rights issues (and reverse splits) but not for cash dividends. If a stock went ex-bonus or ex-rights recently, the previous session's levels already reflect the adjustment, so compare them with the current price rather than with older chart prints.
Keep going
Related tools
Fibonacci Retracement Calculator
Retracement and extension levels between any swing high and low.
PSX Upper & Lower Lock Calculator
Today's circuit breaker limits for any PSX stock, from the previous close.
Risk Reward & Stop Loss Calculator
Risk to reward ratio, stop-loss and target prices, and the win rate a setup needs.
PSX guides
Learn the ideas behind the numbers
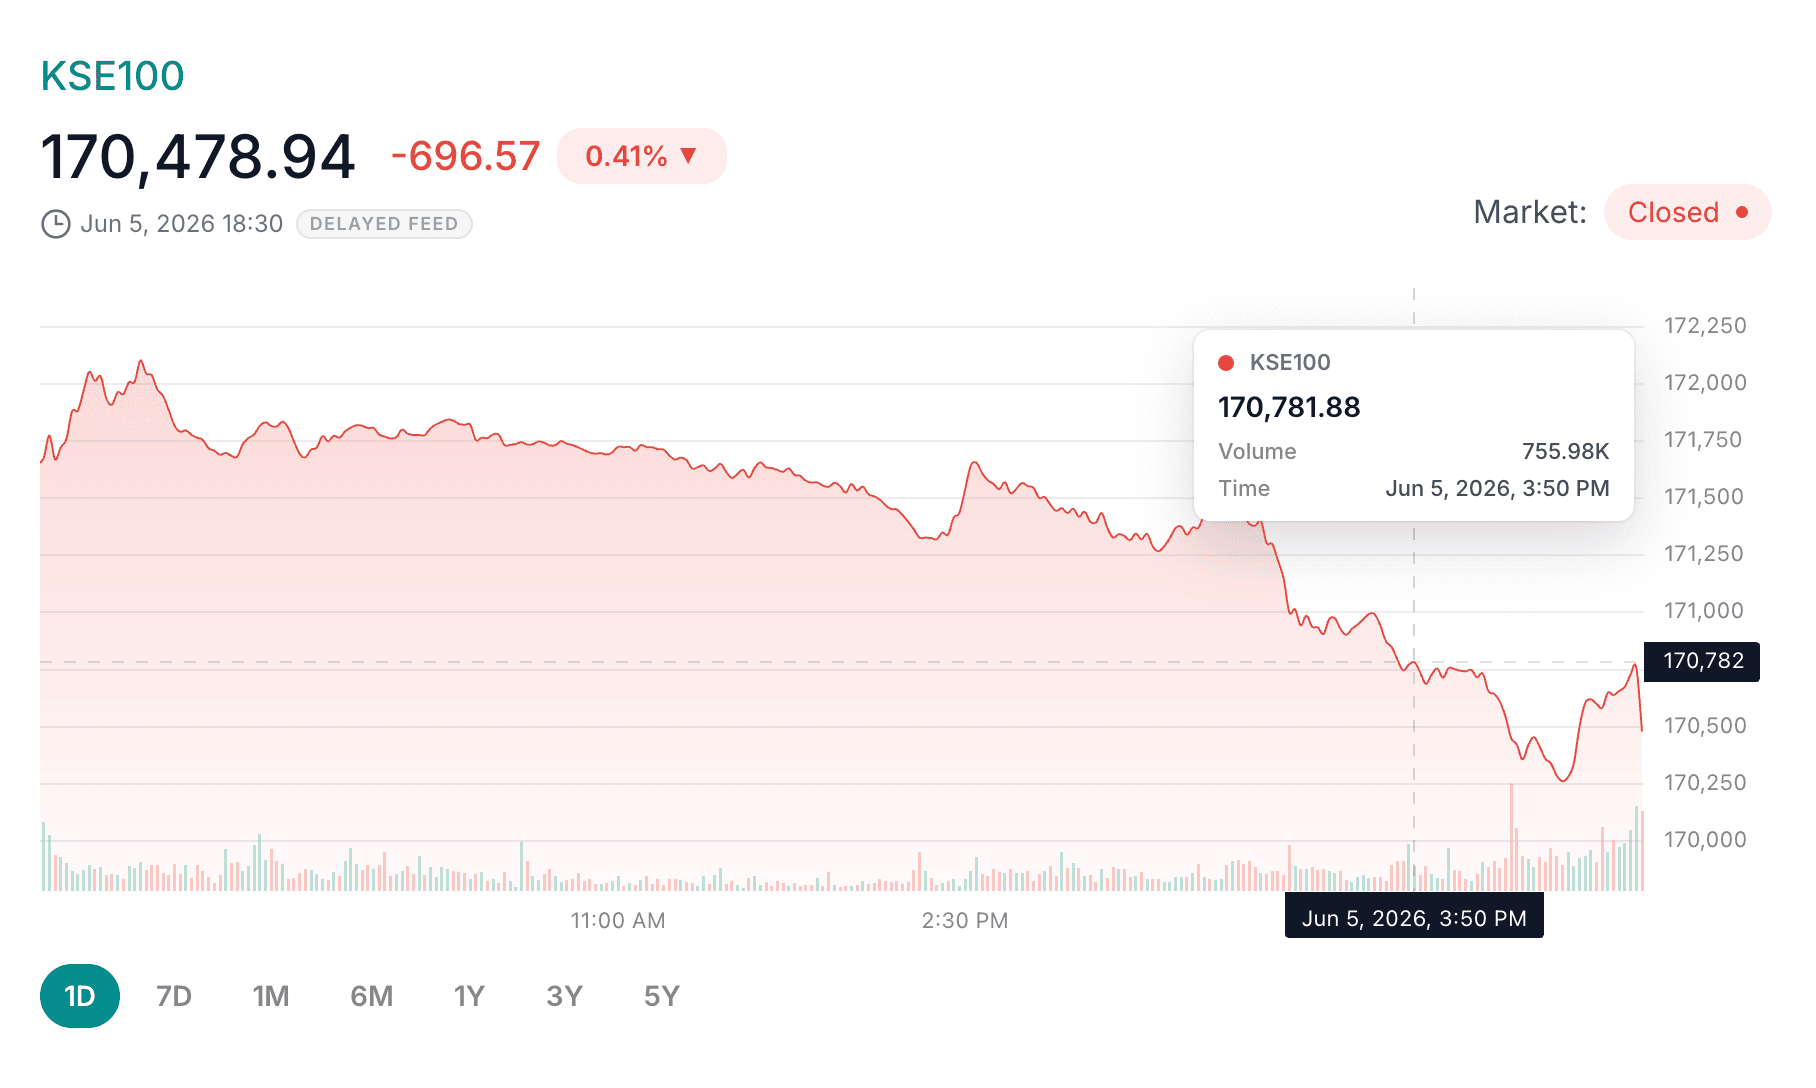
How to Read Stock Charts and Market Trends on PSX
Learn how to read PSX stock charts, price trends, volume bars, timeframes, day range and technical indicators without treating charts as guaranteed predictions.
Read guide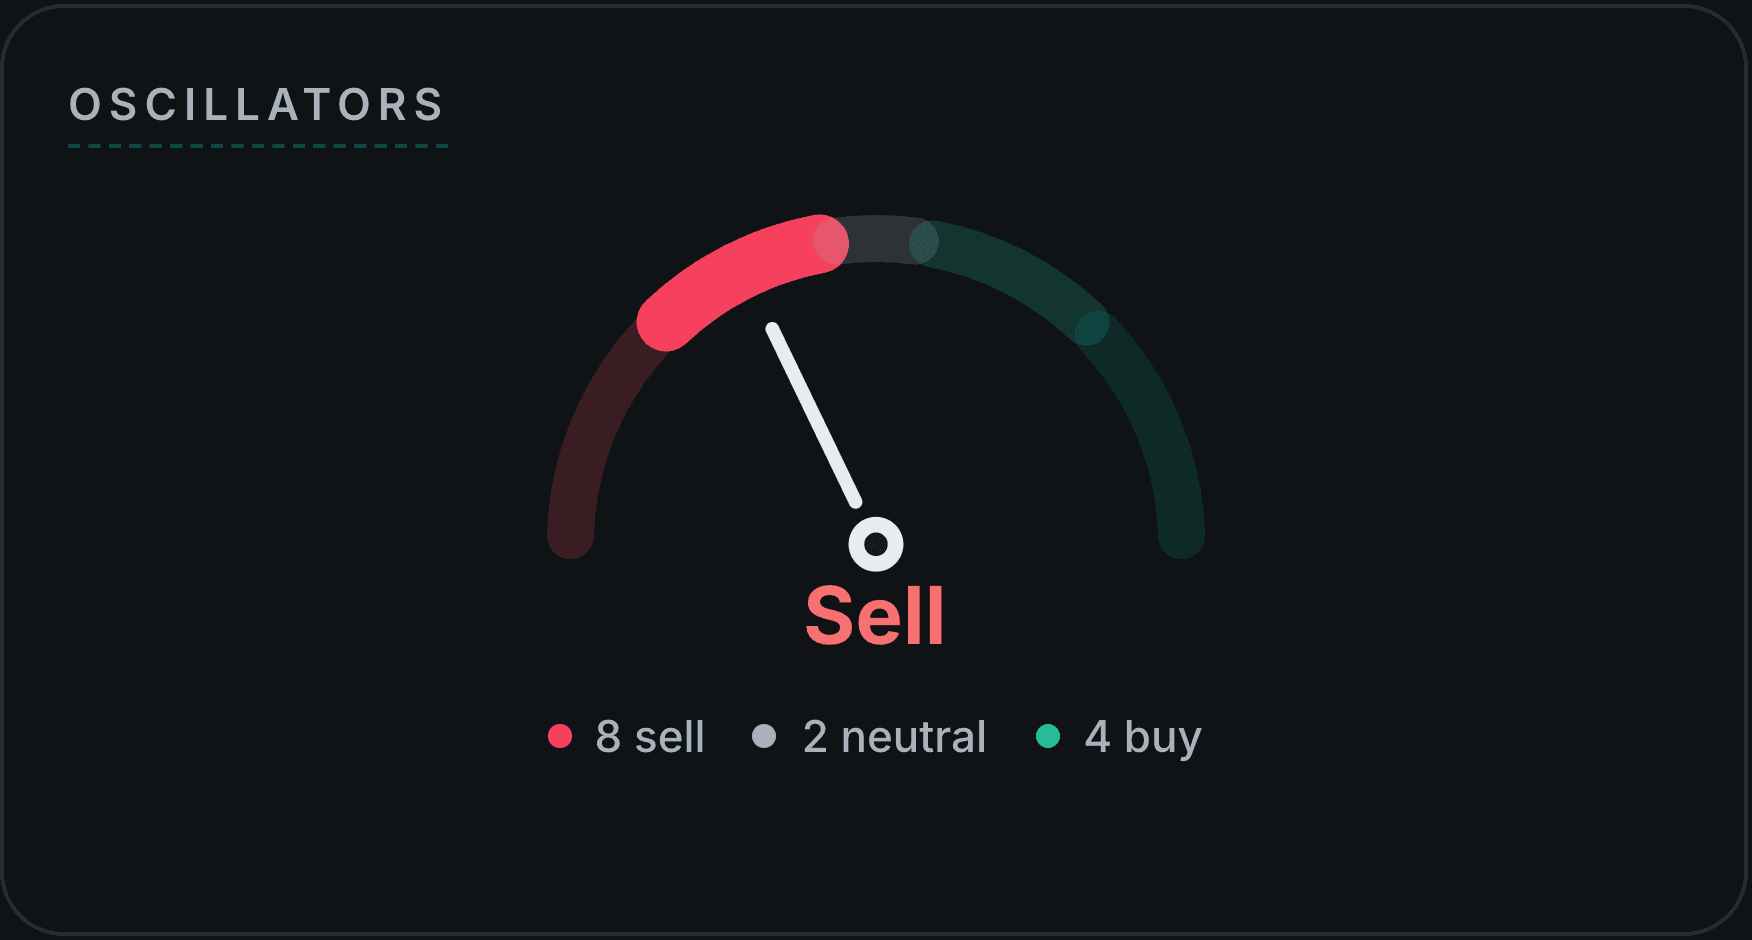
How to Read the Technicals Tab on Investify: A Beginner's Guide
A detailed, section-by-section guide to Investify's Technicals tab for PSX stocks: the buy/sell verdict gauges, Standouts, pivots and ranges, volume, every oscillator (RSI, MACD, Stochastic, ADX and more), moving averages, Bollinger Bands and ATR, all explained in plain English.
Read guide
PSX Market Hours and Trading Calendar
Learn Pakistan Stock Exchange market hours, regular and Ramadan trading sessions, Friday timing differences, trading session terms and the main PSX holidays investors should know.
Read guide