
CAGR Calculator
THE BRIDGE
What do you want to know?
Works for any two values: a portfolio, a share price, profits or an index level.
OVER 6 YEARS
16.5%a year
Rs 500,000 became Rs 1,250,000: that is the same as earning this every single year.
+150%
in total
2.5×
the money
4.5 yrs
to double
THE TOTAL RETURN TRAP
+150% in 6 years is not 25% a year
Growth compounds, so dividing the total by the years overstates the yearly rate. Ads that quote a total return over many years look bigger than they are.
YARDSTICKS
It beats inflation
After 9.3% average inflation, 16.5% is about +6.6% a year in real terms.
- Compounding at 16.5% a year
- Straight line (same gain, no compounding)
Added or took out money on the way? CAGR cannot see that: use the XIRR calculator.
How the CAGR calculator works
CAGR answers one question: what steady yearly growth rate would turn the starting value into the ending value over this period? It takes the total growth multiple, spreads it evenly across the years by taking a root, and converts it to a percentage. Because the growth compounds, the path it draws is a curve, not a straight line.
- Start, End
- the value at the beginning and the end
- n
- number of years between them (whole or fractional)
The second form runs the other way: give it a start value and a CAGR and it returns the end value, which is how “What will it grow to?” works. If you only have dates, tap “Use two dates instead” and the calculator counts whole calendar years plus the fraction of the last part-year.
A worked example
Suppose Rs 500,000 grows to Rs 1,250,000 over 6 years. The absolute (total) return is +150%, because the money is 2.5 times the start. The CAGR is 16.5% a year. Check it by compounding the other way: Rs 500,000 × (1 + 16.5%)^6 = Rs 1,250,000.
Dividing the total return by the number of years gives 25%, which looks higher than the CAGR because it ignores compounding. That shortcut overstates the steady rate, and the longer the period, the bigger the overstatement.
The growth rate a target needs
Work backwards from a goal: the table shows the CAGR needed to turn money into 2, 3, 5 or 10 times its starting value over different periods. For doubling, the rule of 72 gives the answer in your head.
| Target multiple | In 5 years | In 10 years | In 15 years | In 20 years |
|---|---|---|---|---|
| 2x | 14.9% | 7.2% | 4.7% | 3.5% |
| 3x | 24.6% | 11.6% | 7.6% | 5.6% |
| 5x | 38% | 17.5% | 11.3% | 8.4% |
| 10x | 58.5% | 25.9% | 16.6% | 12.2% |
CAGR vs average annual return
The average annual return is the most common way to mislead yourself. Take an investment that rises 50% in year one and falls 50% in year two. The average of +50% and −50% is exactly 0%, so it sounds like you broke even. But Rs 100 becomes Rs 150 and then Rs 75, a loss of 25%, which is a CAGR of -13.4% a year.
| Yearly returns | Average return | Rs 100 becomes | CAGR |
|---|---|---|---|
| +50%, −50% | 0% | Rs 75.00 | -13.4% |
| +40%, −25%, +30%, −10% | 8.75% | Rs 122.85 | 5.28% |
The gap between the two columns is volatility drag. The bumpier the ride, the further the CAGR sits below the average, which matters in a market like the PSX where yearly swings of 30% or more have happened. Pick “My yearly returns” in the calculator to see this with your own numbers, and use CAGR, not the average, when comparing funds or stocks.
CAGR vs XIRR and IRR
CAGR needs exactly two numbers: what you started with and what you ended with. That is perfect for a single purchase, but it breaks down when money goes in at different times. A SIP of Rs 20,000 a month for three years does not have a "start value" or a three-year holding period for every rupee. For that, use XIRR, which weighs every investment, dividend and sale by its date. The XIRR calculator does exactly that, and IRR is the same idea assuming equally spaced cash flows. For monthly investing, see the SIP calculator.
Using CAGR with PSX returns and inflation
- Price CAGR leaves out dividends. A share's price growth understates what a dividend payer returned. See total return in the PSX stock return calculator or index returns in the KSE-100 return calculator.
- Beat inflation first. Real return = (1 + nominal) ÷ (1 + inflation) − 1. A 14% CAGR with 7% inflation is a real return of 6.54%, not 7%. Check history in the inflation calculator.
- Pick periods fairly. A CAGR from a market low to a market high flatters the result. Compare several start dates, and read the CAGR next to the value a lumpsum would reach.
Sources and assumptions
- Calculation: CAGR = (end ÷ start)^(1 ÷ years) − 1; end value = start × (1 + CAGR)^years
- Dates: whole calendar years plus the fraction of the final part-year, so ten anniversaries is exactly 10 years
- Pakistan Bureau of Statistics: Consumer Price Index, to compare CAGR with inflation
- Pakistan Stock Exchange: index and company price history
Results are estimates for information and planning only, not tax, legal or investment advice. Check your own case with a tax adviser, your broker or the official source before acting.
FAQ
CAGR Calculator: common questions
What is CAGR?+
CAGR (compound annual growth rate) is the single, steady yearly rate that would take an investment from its starting value to its ending value over a period, with growth compounding each year. It smooths bumpy real-life returns into one comparable number.
How do I calculate CAGR?+
CAGR = (ending value ÷ starting value)^(1 ÷ years) − 1. For example, Rs 500,000 that grows to Rs 1,250,000 in 6 years is 2.5 times the start, and 2.5^(1/6) − 1 is 16.5% a year. Enter your start value, end value and period above and the calculator does it for you, or use two dates if you do not know the exact number of years.
What is the difference between CAGR and average annual return?+
The average annual return adds up yearly returns and divides by the number of years, which ignores compounding. If an investment gains 50% one year and loses 50% the next, the average is 0% but Rs 100 has fallen to Rs 75, a CAGR of -13.4% a year. CAGR matches your actual money. The average is always higher than CAGR when returns vary.
What is the difference between CAGR and XIRR?+
CAGR assumes one amount invested at the start and one value at the end. XIRR handles several investments and withdrawals on different dates, such as monthly buys, dividends and a sale. If you invested once, the two give the same answer. If you invested in instalments, use XIRR, because CAGR would misjudge when each rupee was actually working.
What is a good CAGR for PSX stocks or mutual funds?+
There is no single answer, because it depends on the period you pick and what inflation did. Compare any CAGR with inflation and with a risk-free alternative such as National Savings or a bank deposit. A return only counts as real growth if it beats inflation, and an equity return should beat deposit rates by enough to pay for the extra risk.
Can CAGR be negative?+
Yes. If the ending value is lower than the starting value, the CAGR is negative, and it shows the steady yearly loss that would produce the same fall. The calculator shows negative values clearly and still draws the compounding path.
How do I find the CAGR needed to reach a target?+
Pick "What return do I need?" at the top of the calculator. Enter the amount you have, the amount you want and the number of years. For example, doubling money in 10 years needs about 7.18% a year and tripling it needs about 11.61%. The calculator also shows how long the same target takes at fixed rates like 8%, 12%, 15% and 20%.
Keep going
Related tools
XIRR Calculator
Annualised return on irregular buys, sells and dividends, on their actual dates.
PSX Stock Return Calculator
What an investment in any PSX stock would be worth today, from real price history.
Lumpsum Investment Calculator
The future value of a one-time investment, before and after inflation.
PSX guides
Learn the ideas behind the numbers

How to Research PSX Companies Before Buying Shares
A practical PSX company research checklist for beginners: read stock pages, fundamentals, charts, technicals, announcements, annual reports and market news before buying.
Read guide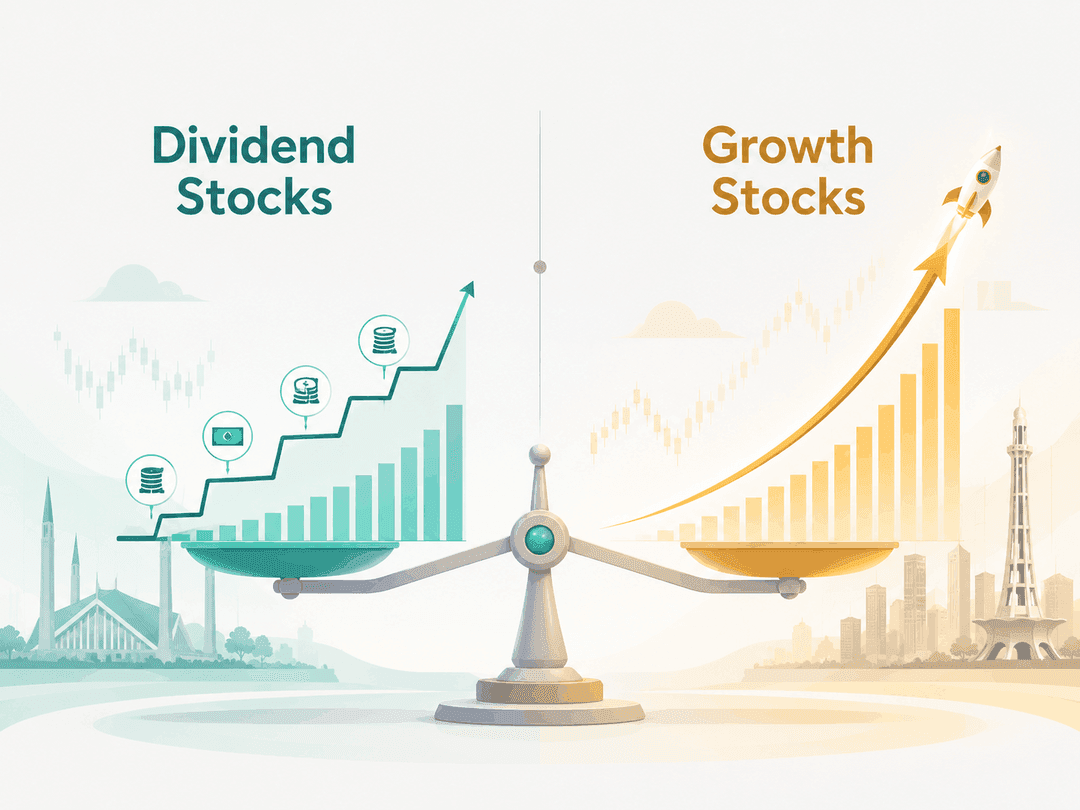
Dividend Stocks vs Growth Stocks on PSX
A beginner-friendly PSX guide comparing dividend stocks and growth stocks, including risks, investor fit, sectors, interest rates and market cycles.
Read guide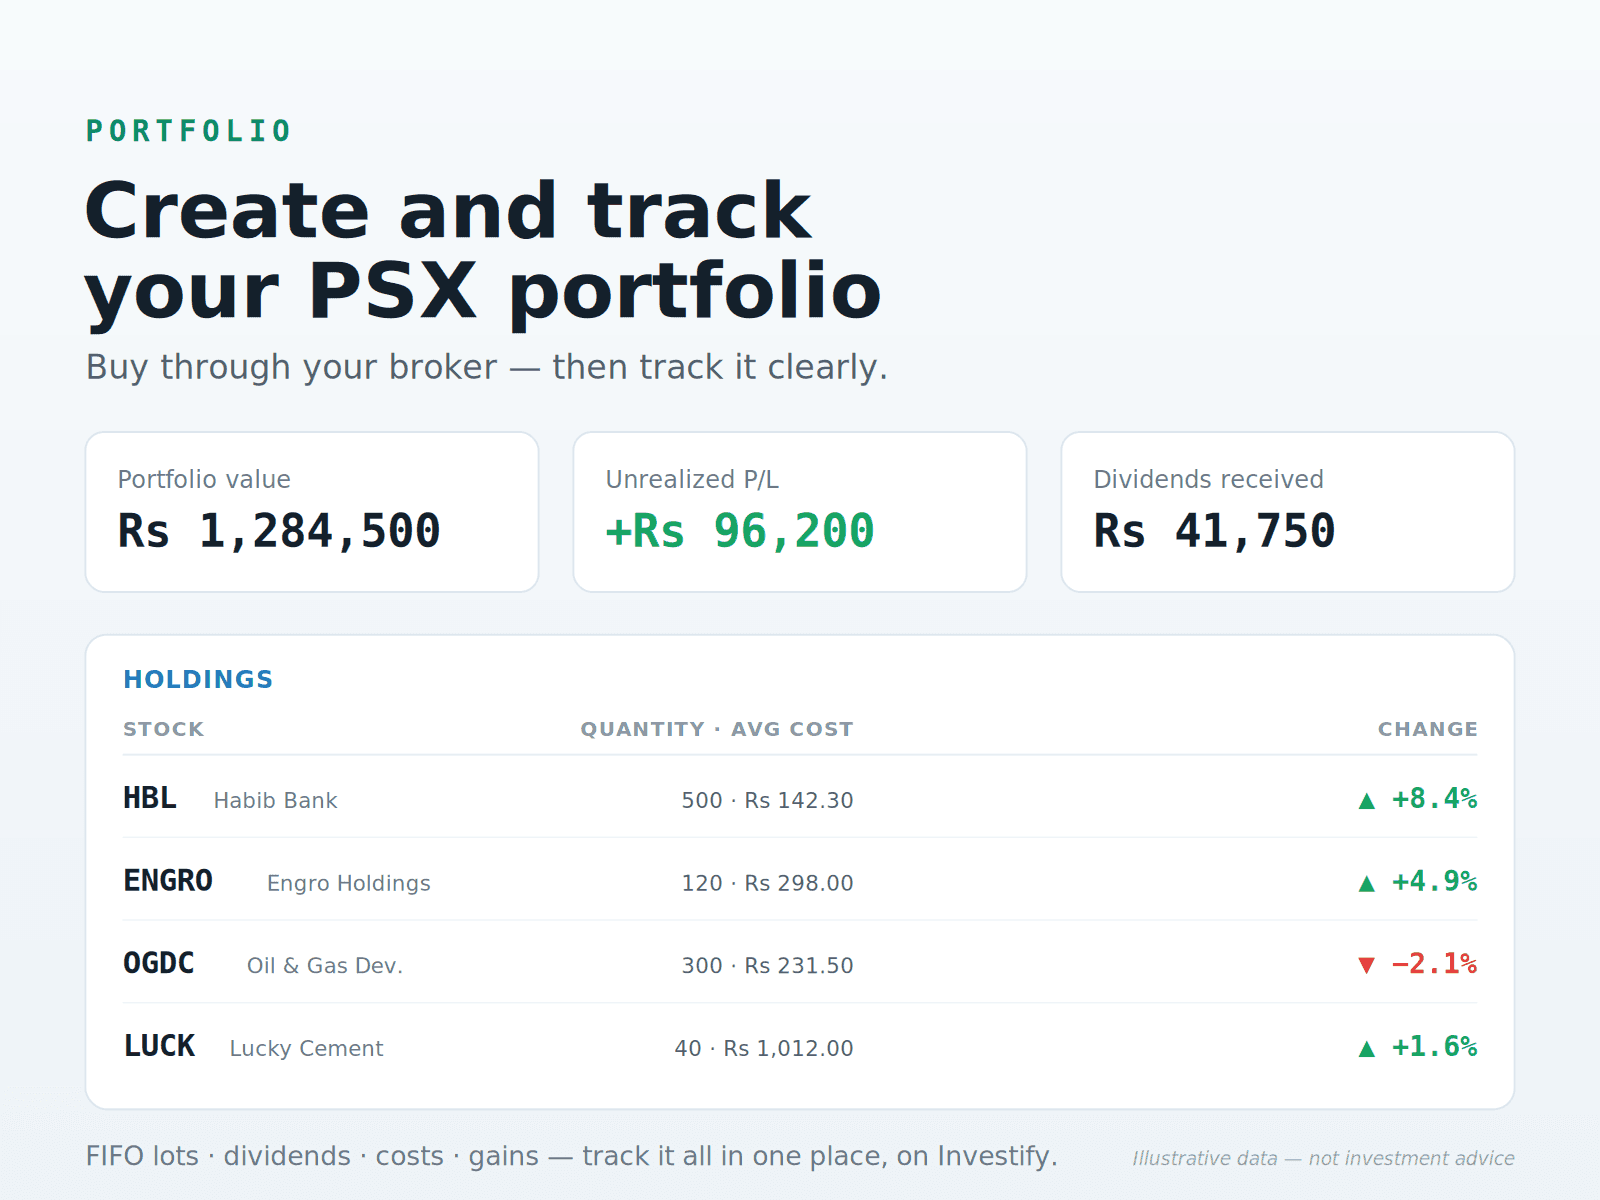
How to Create and Track a PSX Stock Portfolio
Learn how to create a PSX stock portfolio through a licensed broker and track it with FIFO, dividends, costs and corporate actions.
Read guide