
P/E Ratio & Fair Price Calculator
THE STOCK
How many years of profit are you paying for?
Loading the latest figure...
Loading the latest figure...
P/E RATIO
Loading the latest PSX figures for LUCK...
What the P/E ratio tells you
The price-to-earnings ratio is the share price divided by the company's earnings per share. It says how many rupees you pay for each rupee of yearly profit. Flip it over and you get the earnings yield, which lets you compare a share with a bond or a savings account.
Earnings yield = EPS ÷ Price × 100 = 100 ÷ P/E
- Price
- the share price (live last traded price by default)
- EPS
- earnings per share: reported annual EPS (trailing) or expected annualised EPS (forward)
Trailing P/E uses the last reported full year, so it is factual but out of date by the time results age. Forward P/E uses an expected, annualised EPS, so it is current but only as good as the estimate. The calculator shows both whenever the data exists.
PEG: P/E adjusted for growth
A high P/E can be fair for a company that is growing fast, and a low P/E can be poor value for one that is shrinking. The PEG ratio folds growth into the multiple.
- growth
- expected yearly earnings growth in percent points (10 for 10%)
Sign issues. PEG only makes sense when both numbers are positive. A negative growth rate flips the sign and would make a shrinking company look cheap; zero growth is a division by zero; and a negative P/E is not a P/E at all. In those cases the calculator shows n/a rather than a misleading number. The growth rate is also the weakest input: it defaults to the growth the latest results imply (the latest quarters scaled to a full year, against last year's EPS), which is one period and can be a one-off jump. Above 50% the calculator leaves it out, and in the PEG card you can enter your own view.
Fair price at a target P/E, and the reverse
Pick the multiple you think is fair and the calculator turns it into a price. It can also run backwards: given today's price and a target multiple, what EPS would justify paying it?
EPS needed = Price ÷ target P/E
A stock trades at Rs 200.00 with EPS of Rs 25.00 and expected growth of 10%. Its P/E is 8, its earnings yield is 12.5% and its PEG is 0.8. At a target P/E of 10x the fair price is Rs 250.00, which is +25% against the current price, and the EPS needed to justify Rs 200.00 at 10x is Rs 20.00.
| Target P/E | Fair price (EPS Rs 25.00) | Versus Rs 200.00 |
|---|---|---|
| 5x | Rs 125.00 | -37.5% |
| 8x | Rs 200.00 | 0% |
| 10x | Rs 250.00 | +25% |
| 12x | Rs 300.00 | +50% |
| 15x | Rs 375.00 | +87.5% |
What is a normal P/E on the PSX?
There is no honest single answer, so this tool does not invent one. What a P/E should be depends on the interest rate, the sector and the company. Rates are the clearest anchor in Pakistan: with the 10-year PIB yielding 12.85% as of the State Bank's October 7, 2026 auction, a stock needs a P/E of about 7.8 just to match the bond's yield with its earnings. When rates were lower, investors accepted higher multiples; when they rise, multiples tend to compress.
Sectors differ too. Steady, high-payout businesses and cyclical ones are usually valued on lower multiples than companies with durable growth. The best comparison is a stock's own P/E history and its sector peers, which you can see on each company's page, for example LUCK, or line up in the stock comparison. The multiple presets (5x, 8x, 10x, 12x, 15x) are starting points for your own judgement, not benchmarks.
What this model misses
- Cyclical peaks. A low P/E on record profits can be a trap. For oil, cement and fertiliser companies, ask whether EPS is a normal year or the top of a cycle.
- One-off gains and losses. Revaluation gains, tax settlements and write-offs move EPS without changing the business. The result announcement shows which.
- Debt and quality. Two companies can have the same P/E and very different balance sheets. P/E says nothing about borrowing, cash conversion or dividends.
- Timing. Trailing EPS lags the price. Forward EPS is an estimate. Neither is the future.
- Growth is nominal. With high inflation, rupee profits can grow while real profits do not. PEG does not adjust for that.
Pair P/E with a cash-based view such as the intrinsic value calculator, a balance-sheet view such as the Graham number, and for payers the dividend yield calculator.
Sources and assumptions
Rates checked October 31, 2026: 10-year PIB cut-off yield 12.85% (State Bank auction, October 7, 2026).
- State Bank of Pakistan, PIB auction results (latest result when checked: 10-year cut-off yield 12.85%, auction held October 7, 2026)
- Peter Lynch, One Up on Wall Street (1989): the PEG ratio
- Price, annual EPS, expected EPS and earnings growth: Investify PSX data, with the reporting period shown beside each number
A P/E, PEG or fair price is a yardstick, not a price target or a recommendation to buy or sell. Results are estimates for information and planning only, not tax, legal or investment advice. Check your own case with a tax adviser, your broker or the official source before acting.
FAQ
P/E Ratio & Fair Price Calculator: common questions
What is a good P/E ratio for a PSX stock?+
There is no single good number. A P/E is only meaningful next to the company's own history, its sector and the interest rate. One anchor is the bond: with the 10-year PIB yielding 12.85%, a P/E of about 7.8 gives the same earnings yield as the bond, so a stock above that multiple is asking you to pay for growth. Use the target P/E presets to see what each multiple implies for the price.
What is the difference between trailing and forward P/E?+
Trailing P/E divides the price by the EPS the company actually reported for its last full year. Forward P/E divides by an estimate of coming earnings, here the annualised expected EPS. Trailing is factual but looks backwards, forward looks ahead but depends on an estimate that can be wrong.
What is earnings yield?+
Earnings yield is EPS divided by price, the flip side of P/E (a P/E of 8 is an earnings yield of 12.5%). It lets you compare a share with a bond or a savings rate on the same footing: how much the company earns each year for every rupee you pay.
What is the PEG ratio and what is a good PEG?+
PEG is the P/E divided by expected yearly earnings growth in percent. A PEG near 1 means the multiple roughly matches the growth, below 1 can mean the price is low for that growth, and well above 2 can mean you are paying a lot for it. It is a rule of thumb popularised by Peter Lynch, not a law, and it works best when comparing companies in the same sector.
Why does the calculator show n/a for the PEG?+
PEG is only meaningful when the P/E and the growth rate are both positive. Dividing by a negative growth rate flips the sign and would make a shrinking company look cheap, and a zero growth rate would be a division by zero, so the calculator shows n/a instead. It also shows n/a when a stock has no growth estimate, or when the latest results imply growth above 50%, which usually means a one-off jump such as a recovery from a weak year. Add your own growth estimate in the PEG card.
Can a low P/E be a warning sign?+
Yes. A low P/E can mean a bargain, but it can also mean earnings are at a peak and expected to fall, or that the market doubts the earnings are real or lasting. Cyclical companies often look cheapest just before profits drop. Check whether the latest EPS includes one-off gains before trusting a low multiple.
Why is P/E not shown for my stock?+
P/E needs positive earnings. When a company reports a loss, price divided by EPS is negative and tells you nothing useful, so the calculator shows n/a and suggests other measures such as price to book.
Keep going
Related tools
Graham Number Calculator
Benjamin Graham's fair value from EPS and book value, for any PSX stock.
Intrinsic Value (DCF) Calculator
A discounted earnings or cash-flow value per share, with margin of safety.
Compare PSX Stocks
Two to four PSX stocks side by side: price, returns, valuation, dividends and profitability.
PSX guides
Learn the ideas behind the numbers
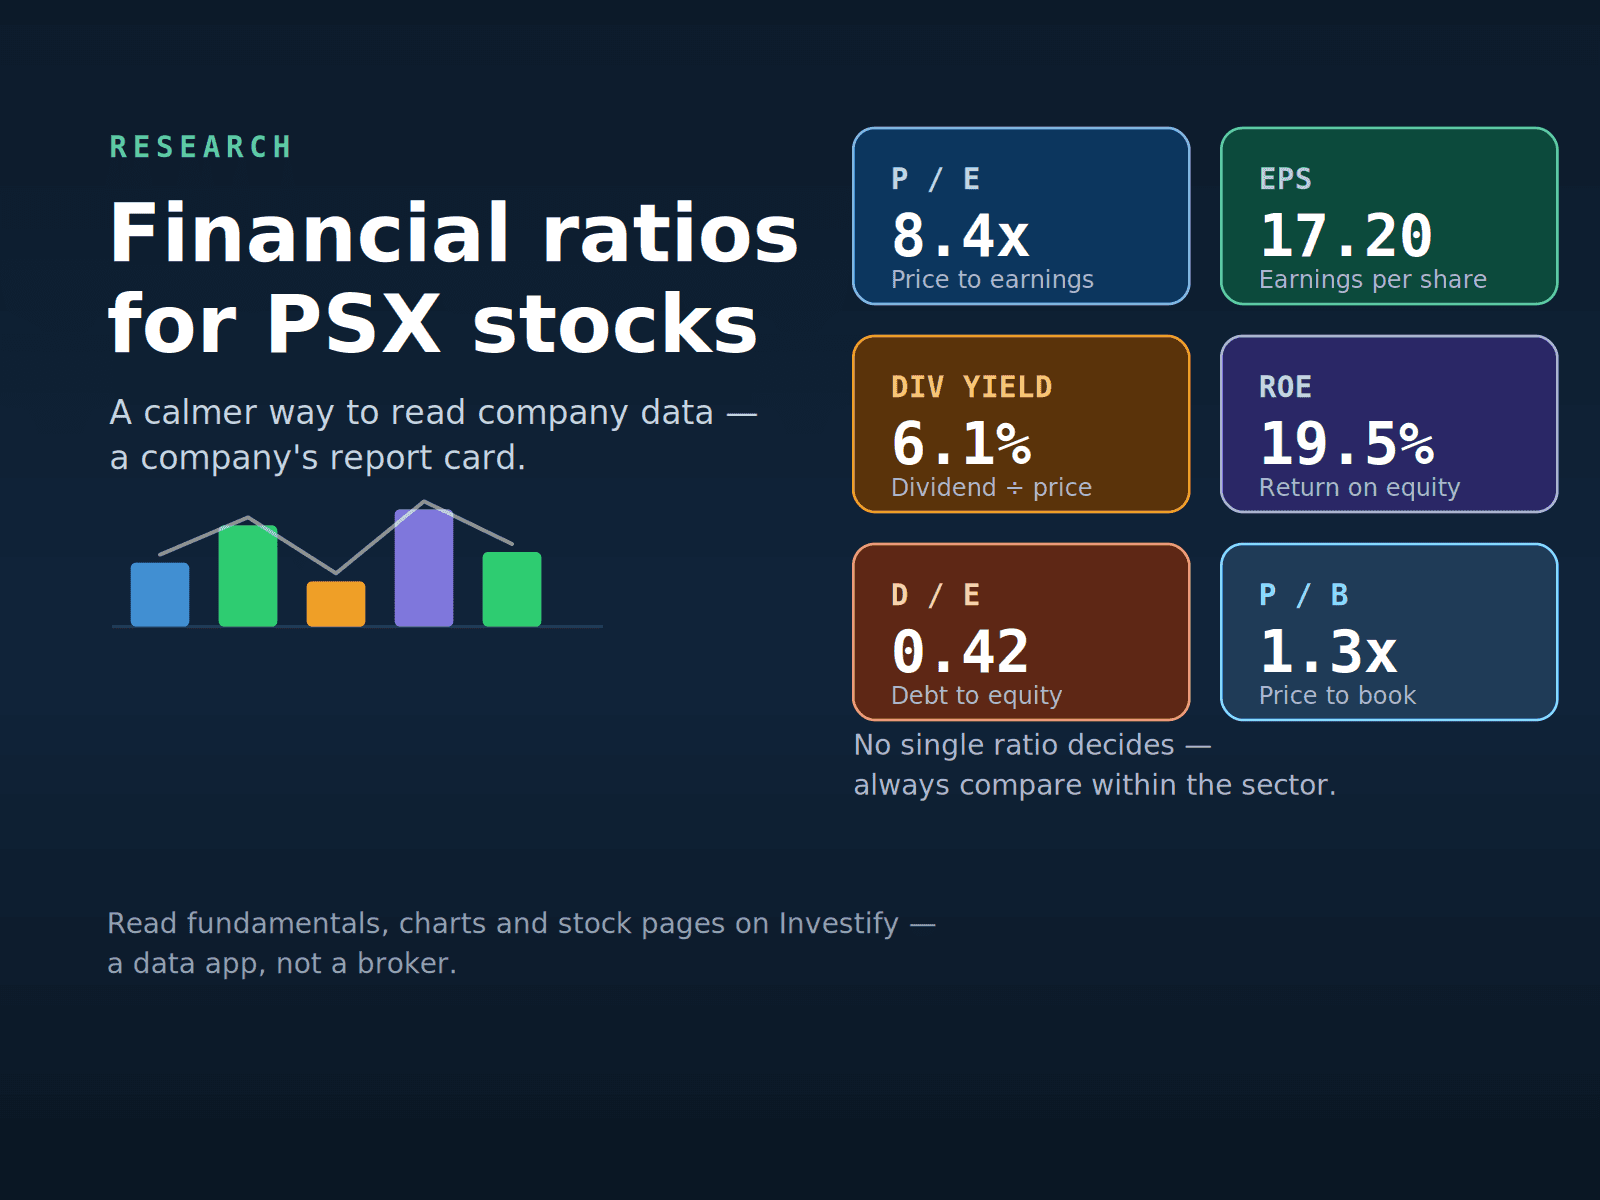
Beginner-Friendly Financial Ratios for PSX Stocks
A simple guide to key financial ratios for Pakistan Stock Exchange stocks, including EPS, P/E, dividend yield, book value, ROE, margins, debt ratios and how beginners should read them.
Read guide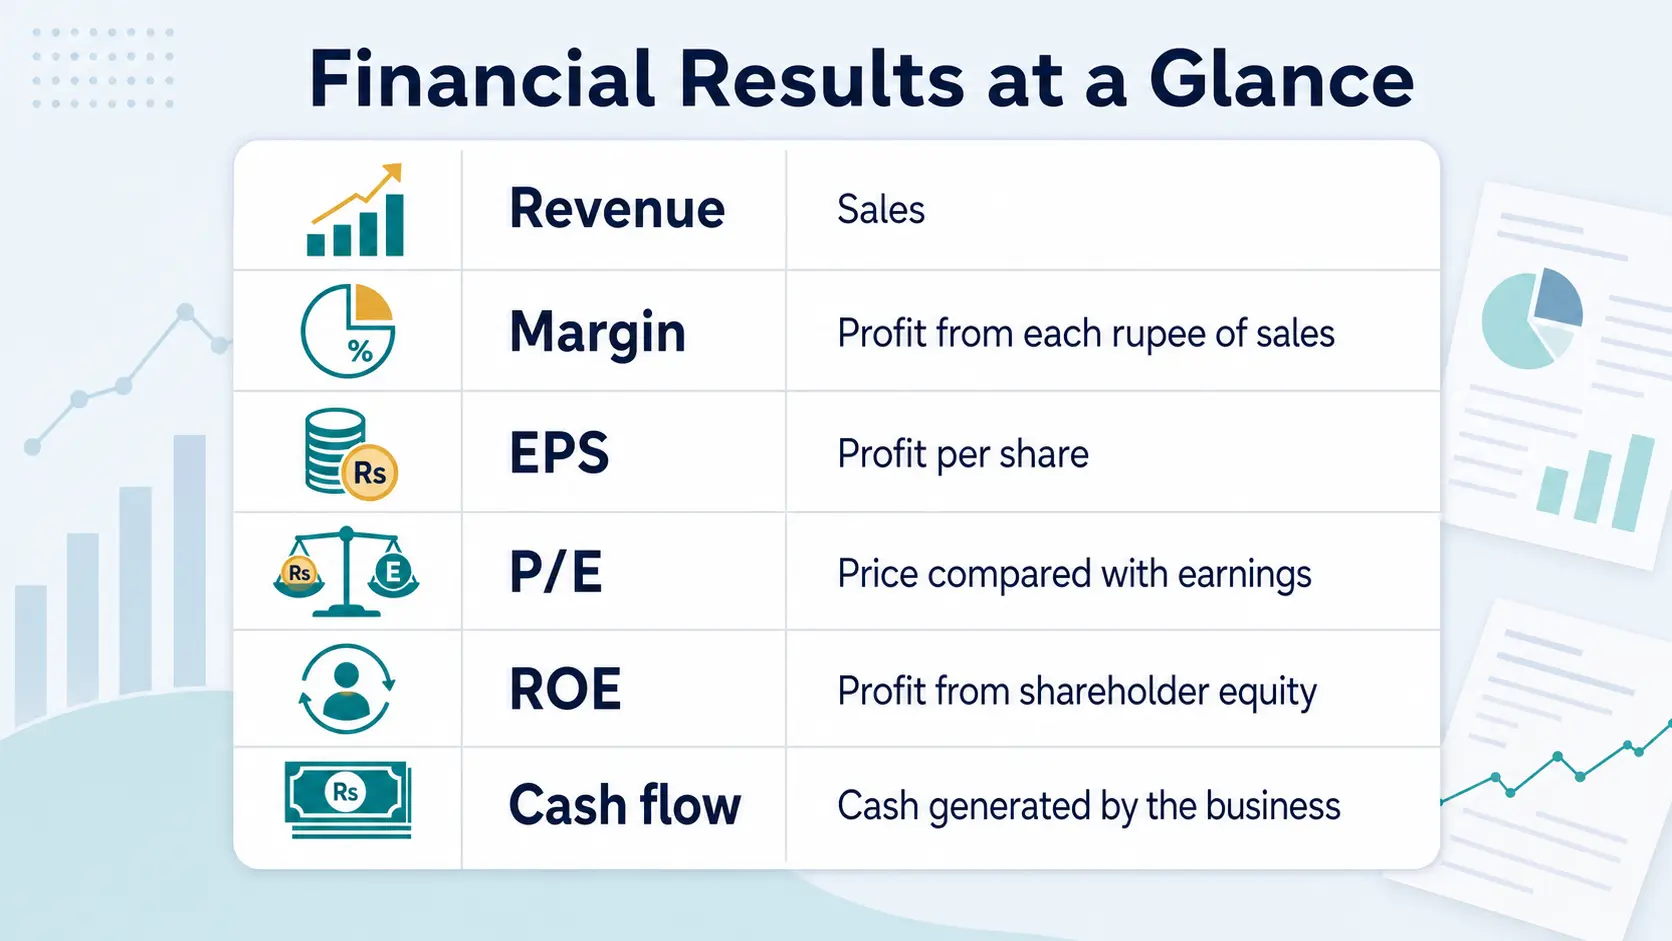
PSX Financial Results Explained: EPS, Revenue, Profit and Dividends
Learn how to read PSX financial results: revenue, margins, EPS, dividends and cash flow, so company earnings announcements finally make sense.
Read guide
How to Research PSX Companies Before Buying Shares
A practical PSX company research checklist for beginners: read stock pages, fundamentals, charts, technicals, announcements, annual reports and market news before buying.
Read guide