 OGDCOGDC
1 YEAR
...
—
Wins 0 of 0

THE LINE-UP
ROUND BY ROUND
| Metric |  OGDCOGDC | PPLPPL | MARIMARI |
|---|---|---|---|
| Price and performance | |||
| Share price | — | — | — |
| Today | — | — | — |
| 1 monthPrice change | ... | ... | ... |
| 6 monthsPrice change | ... | ... | ... |
| 1 yearPrice change | ... | ... | ... |
| Since November 2021Price change | ... | ... | ... |
| Risk (since november 2021) | |||
| VolatilityAnnualised, daily log returns | ... | ... | ... |
| Biggest fall from a peakMaximum drawdown | ... | ... | ... |
| Valuation | |||
| Market cap | — | — | — |
| P/EPrice ÷ latest annual EPS | — | — | — |
| P/BPrice ÷ book value per share | — | — | — |
| EPSAnnual, Rs per share | — | — | — |
| Book value per shareRs | — | — | — |
| Dividends | |||
| Dividend per shareLatest annual, Rs | — | — | — |
| Dividend yieldAnnual DPS ÷ price | — | — | — |
| Payout ratioShare of profit paid out | — | — | — |
| Profitability | |||
| Return on equity | — | — | — |
| Net profit margin | — | — | — |
| Profile | |||
| Sector | — | — | — |
| Shariah compliantIn the KMI All Share index | — | — | — |
A trophy marks the best in each row (highest return, yield and ROE; lowest P/E, P/B and risk). Most wins is a tally, not a verdict: a low P/E can be low for a reason. Prices adjusted for bonus shares and splits, not dividends. P/E and P/B use today's price with the latest annual EPS and book value. Company details link to each stock page.
Loading price history...
Each column is one stock. Live prices and the day's change come from the market feed, the valuation, dividend and profitability rows from the latest annual results, and the return and risk rows from daily closing prices. For the performance chart and the risk rows, every stock is measured over the same window, starting on the first date they all have prices, so a newer listing does not get compared over a longer stretch than the others.
Rebasing makes a Rs 50 stock and a Rs 400 stock comparable: both start at 100, and a line at 150 means the price is up 50% whatever it cost. The shaded cell on each row marks the best of the group only where a better direction exists: the highest return, dividend yield and ROE, the lowest P/E, P/B, volatility and fall. Size, share price and payout have no better or worse, so they are not shaded.
| Row | What it tells you |
|---|---|
| 1 month, 6 months, 1 year, since November 2021 | Price change over each period (no dividends) |
| Volatility | How wildly the daily price swings, annualised |
| Biggest fall from a peak | The deepest loss from a high to a later low in the window |
| Market cap | Share price × shares outstanding: the company's size |
| P/E | Price ÷ annual EPS: rupees you pay for each rupee of yearly profit |
| P/B | Price ÷ book value per share: price against net assets |
| EPS, book value, dividend per share | Per-share profit, net assets and cash paid out, in rupees (not comparable across stocks by size) |
| Dividend yield, payout ratio | Cash return at today's price, and the share of profit paid out |
| ROE, net profit margin | How much profit the company earns on shareholders' money and on each rupee of sales |
| Sector, Shariah compliant | The company's sector, and whether it is in the KMI All Share index today. To test a company's own accounts against the screens, use the Shariah compliance checker |
As a feel for the risk rows: a stock that rises 1% one day and falls back the next, for forty days, has an annualised volatility of about 15.9%. A price path of 100, 120, 90, 110, 60, 130 has a biggest fall of 50% (from 120 down to 60), even though it ends higher than it started.
Sources and assumptions
Method and metric definitions reviewed October 31, 2026.
Shading marks the highest or lowest value on a row, it is not a recommendation. Results are estimates for information and planning only, not tax, legal or investment advice. Check your own case with a tax adviser, your broker or the official source before acting.
FAQ
Start with the same sector, because valuation norms differ: banks, oil and gas, fertiliser and cement each trade on different multiples. Then compare what you pay (P/E, P/B, dividend yield), what the business earns (ROE, net margin), how the price has behaved (returns, volatility, biggest fall) and how big the company is. This tool puts all of those in one table for two to four stocks.
There is no single best ratio. For profitable companies P/E is the usual first look, for banks P/B together with ROE, and for income investors dividend yield together with the payout ratio, so you can see whether the dividend is covered by profit. Use several together and compare each with the stock's own history and its peers.
No. A low P/E can mean a bargain, but it can also mean the market expects profit to fall, or that the profit is a one-off. Cyclical companies often look cheapest at the top of their cycle. That is why the table only shades the lowest P/E and does not call it the winner.
It is the latest annual dividend per share divided by today's share price. If a stock paid Rs 20 over the last year and trades at Rs 200, the yield is 10%. The yield changes whenever the price moves, and a past dividend is not a promise of a future one.
Volatility is how much the daily price moves, scaled to a year (the standard deviation of daily log returns times the square root of 248 trading days). A higher number means a bumpier ride. The biggest fall from a peak is the largest drop from a high close to a later low close in the chosen window, the loss you would have sat through if you bought at the worst time.
A cell is blank when the data is not available, for example for a newly listed company or a stock with no price history. P/E shows n/m (not meaningful) when the latest annual EPS is a loss, because a negative P/E is not useful.
It shows whether the stock is currently a member of the KMI All Share Islamic index, which screens companies for Shariah compliance. Membership is reviewed periodically, so check the latest status before investing, and test a company against the screening ratios with the Shariah compliance checker.
That is where our daily price history begins. The 'since' return, volatility and the chart use that data. A company that listed later starts from its first session in our history, and the table marks it with a dagger.
Keep going
What an investment in any PSX stock would be worth today, from real price history.
P/E, earnings yield, PEG and the price a target P/E implies.
Dividend yield and yield on cost for any PSX stock, from the latest annual payout.
PSX guides
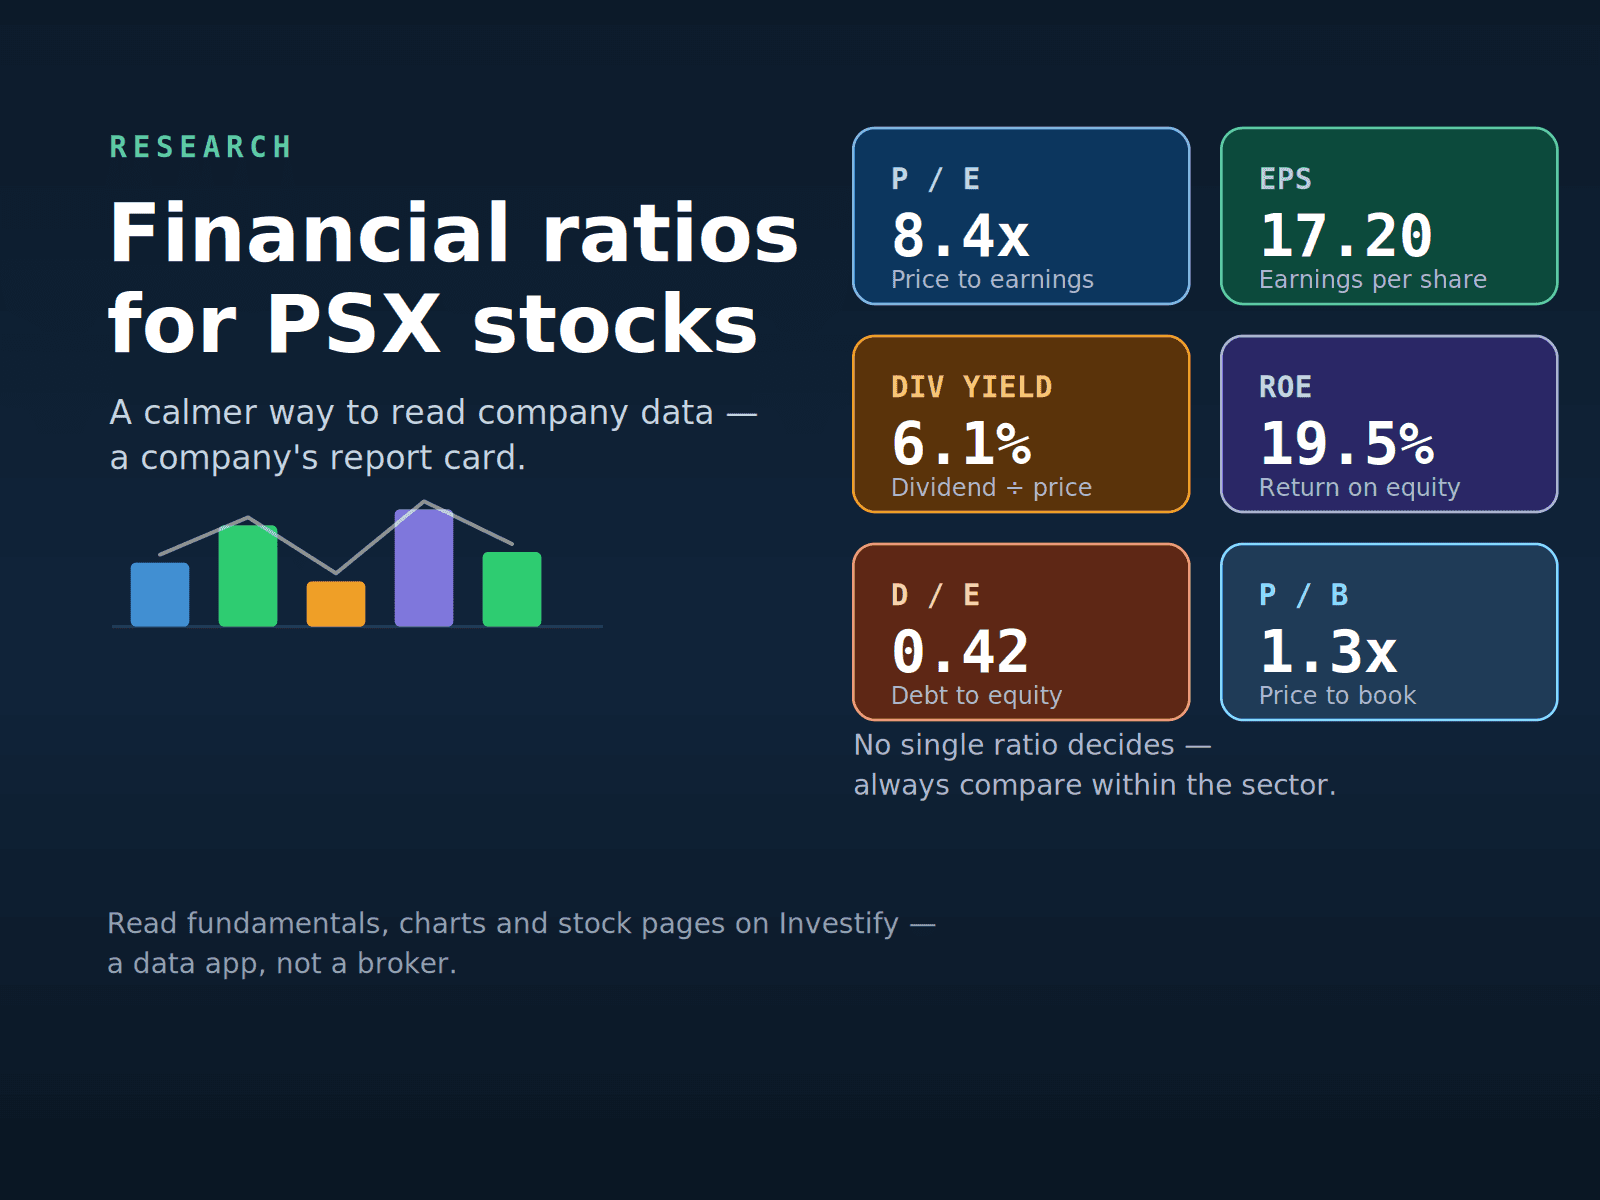
A simple guide to key financial ratios for Pakistan Stock Exchange stocks, including EPS, P/E, dividend yield, book value, ROE, margins, debt ratios and how beginners should read them.
Read guide
A practical PSX company research checklist for beginners: read stock pages, fundamentals, charts, technicals, announcements, annual reports and market news before buying.
Read guide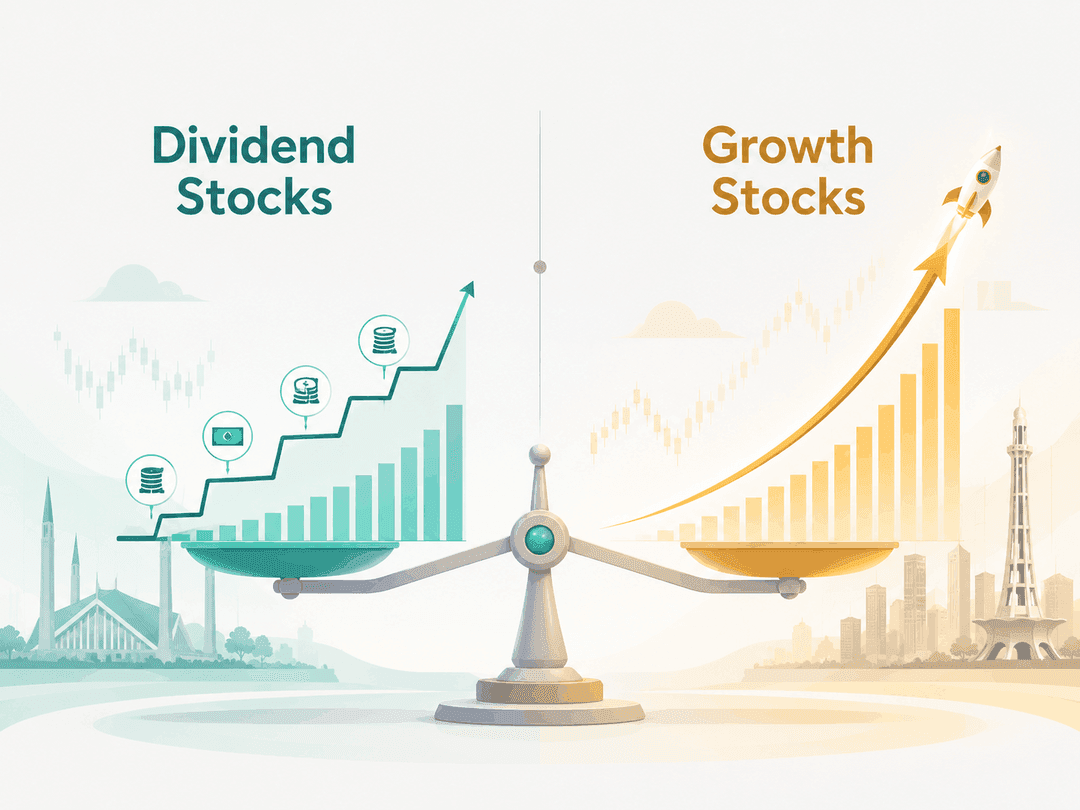
A beginner-friendly PSX guide comparing dividend stocks and growth stocks, including risks, investor fit, sectors, interest rates and market cycles.
Read guide32 indicators summed up in plain words, with live prices and filings on every PSX stock.