
Risk Reward & Stop Loss Calculator
YOUR TRADE
Is the reward worth the risk?
Market price is not available, so this is an example. Enter your own price.
A Rs 356,000 position.
Stop at Rs 338.20.
Target at Rs 391.60.
Waiting for a market price for PSO. Until it arrives, or if the symbol is not listed, the numbers below use an example price. Type your own price to override it.
RISK TO REWARD
1 : 2
Risk Rs 17,800 to make Rs 35,600.
Win 33% of trades like this to break even: about 4 in 10.
YOUR EDGE
About +Rs 3,560 a trade on average
If 40% of trades like this reach the target and the rest hit the stop, each trade is worth +0.2R over many trades.
TARGETS BY R
One R is Rs 17.80 a share, your distance to the stop
Tap one to use it as your target. The last line is the share of trades you need to win to break even.
The trade drawn to scale
TargetRs 391.60
+10% from entry, +Rs 35,600
EntryRs 356.00
1,000 shares
Stop-lossRs 338.20
-5% from entry, -Rs 17,800
To size the trade from your account and the loss you can take, use the position size calculator.
How risk to reward works
Every trade has a downside you accept and an upside you hope for. The stop-loss sets the downside: the price at which you leave and take the loss. The target sets the upside. The distance from your entry to each, multiplied by your shares, is the money at stake each way.
- R
- reward to risk ratio of the target
- Break-even win rate
- share of trades that must reach the target for the strategy to make zero
That second line is the part most people miss. The ratio tells you how often you need to be right, not whether you will be. A 1 : 1 trade needs to win half the time. A 1 : 3 trade only needs to win a quarter of the time, but that is only useful if your targets are reached about that often.
A worked example
Buy 1,000 shares at Rs 100, stop-loss at Rs 95, target Rs 115. You risk Rs 5 a share (Rs 5,000) to make Rs 15 a share (Rs 15,000): a ratio of 1 : 3, so you break even at a 25% win rate.
With 0.37% round-trip costs, the stop loses Rs 5.36 a share and the target wins Rs 14.60, so the break-even win rate edges up to 26.9%. If you win 40% of trades like this, the expected result is Rs 3.00 a share, or 0.6R, on every trade, before costs.
| Target | Price | Move from entry | Win rate to break even | After 0.37% costs |
|---|---|---|---|---|
| 1R | Rs 105.00 | 5% | 50% | 53.7% |
| 2R | Rs 110.00 | 10% | 33.3% | 35.8% |
| 3R | Rs 115.00 | 15% | 25% | 26.9% |
| 4R | Rs 120.00 | 20% | 20% | 21.5% |
| 5R | Rs 125.00 | 25% | 16.7% | 17.9% |
Finding a sensible stop and target
The ratio is only as good as the two prices behind it. Pick them from the chart, not from a wish. A stop belongs just beyond a level that, if broken, says the idea failed: a recent swing low or a support area. A target belongs at a level the price has reacted to before: an earlier high or a resistance zone.
- Pivot points give you ready-made support and resistance for the next session. Try the pivot point calculator.
- Fibonacci retracements mark where a pullback often pauses inside a bigger move. Try the Fibonacci calculator.
- Daily limits cap how far a PSX stock can move in one day, 10% either way (or Re. 1 for stocks under Rs 10). A target far beyond that needs several sessions, and a stop can be skipped on a limit-down day. See the upper and lower lock calculator.
Once the prices are set, size the trade so the stop costs only what you chose with the position size calculator, and price the fees with the brokerage calculator.
Mistakes that make a good ratio worthless
- Stretching the target to flatter the ratio. Moving a target from Rs 115 to Rs 140 turns a 1 : 3 into a 1 : 8, but if the price never gets there the setup loses every time.
- Tightening the stop for the same reason. A very tight stop is hit by normal movement, so the win rate collapses faster than the ratio improves.
- Forgetting costs. On a trade aiming for a small gain, brokerage and taxes are a real share of the reward.
- Moving the stop away. If you drag the stop down to avoid being stopped out, the ratio you planned is no longer the ratio you are running.
Reading the 1R to 5R table
The table turns your stop distance into a ladder of targets. Each row is a multiple of the risk (R), with the price it needs, how far the stock has to move from your entry, the gain on your share count, and the share of trades you must win to break even. Reading across it shows the trade-off in one glance: a 1R target is close and needs a win rate above 50%, while a 4R or 5R target is far away and needs only one trade in five or six to work.
Pair that with how far your stock actually travels. If it usually moves 3% to 4% in a session, a 5R target set 25% away needs a sustained trend, not a good day. Use the table to pick the row that matches a level on the chart (see the pivot points or Fibonacci levels), then compare the win rate it needs with how often your setups really work.
Sources and assumptions
Trading-cost assumption checked October 31, 2026.
- Calculation: reward to risk R = |target − entry| ÷ |entry − stop|; break-even win rate = 1 ÷ (1 + R)
- With costs: risk = |entry − stop| + c × (entry + stop); reward = |target − entry| − c × (entry + target), where c is half the round-trip cost
- PSX security-wise circuit breaker: 10% or Re. 1, whichever is higher (PSX notice N-477, May 20, 2024)
A risk to reward ratio describes a plan, not a forecast. The market can skip your stop and miss your target. Results are estimates for information and planning only, not tax, legal or investment advice. Check your own case with a tax adviser, your broker or the official source before acting.
FAQ
Risk Reward & Stop Loss Calculator: common questions
What is the risk to reward ratio?+
It compares what you stand to gain with what you stand to lose on a trade. Buy at Rs 100 with a stop-loss at Rs 95 and a target at Rs 115: you risk Rs 5 a share to make Rs 15, a reward to risk of 3 to 1, written 1 : 3 or 3R. The ratio says nothing about how likely the target is, only how much it pays when it works.
What is a good risk to reward ratio?+
Many traders look for at least 1 : 2, because a trade paying twice what it risks breaks even when only a third of trades win. A higher ratio is only useful if the target is realistic, so judge it against recent highs, resistance and how far the stock usually moves. A 1 : 5 target that is never reached is worse than a 1 : 2 target that is.
How is the break-even win rate calculated?+
Break-even win rate = 1 ÷ (1 + reward to risk). At 1 : 1 you must win half your trades, at 1 : 2 about 33%, at 1 : 3 25%. With trading costs switched on under More options the calculator also shows the figure after costs, which is a little higher because costs make each loss bigger and each win smaller.
How do I set a stop-loss and a target on a PSX stock?+
Put the stop where your reason for the trade is proven wrong, such as just under a recent low or support level, not at a round percentage. Put the target at a level the price has reacted to before, such as a prior high or a resistance level. Pivot points and Fibonacci levels are two ways to find them; Investify has calculators for both.
Do trading costs change the risk to reward ratio?+
Yes, slightly. Brokerage commission, sales tax and exchange fees are paid on both the buy and the sell, so a stopped-out trade loses a bit more than the price move and a winning trade keeps a bit less. On a tight trade the effect is noticeable. Switching on trading costs under More options adds a 0.37% round-trip cost by default (more for shares under about Rs 20), and the brokerage calculator gives exact fees.
Can a good risk to reward ratio still lose money?+
Yes. The ratio is only half of the result; the other half is how often you win. A 1 : 3 setup that wins 20% of the time loses money over many trades, while a 1 : 1 setup that wins 60% of the time makes money. Expectancy combines the two: win rate × reward − loss rate × risk, and the Your edge card shows it.
What does 1R, 2R or 3R mean?+
R is your risk on the trade, the distance from entry to stop-loss. A 2R target is twice that distance above your entry. Measuring results in R makes trades comparable even when the share price and position size differ.
Keep going
Related tools
Position Size Calculator
How many shares to buy so a stop-loss costs you only the risk you chose.
PSX Brokerage & Trading Profit Calculator
Every fee on a PSX trade (commission, sales tax, CDC, NCCPL, SECP) and your net profit and break-even.
Pivot Point Calculator
Classic, Fibonacci, Camarilla, Woodie and DeMark pivots, prefilled from any PSX stock.
PSX guides
Learn the ideas behind the numbers
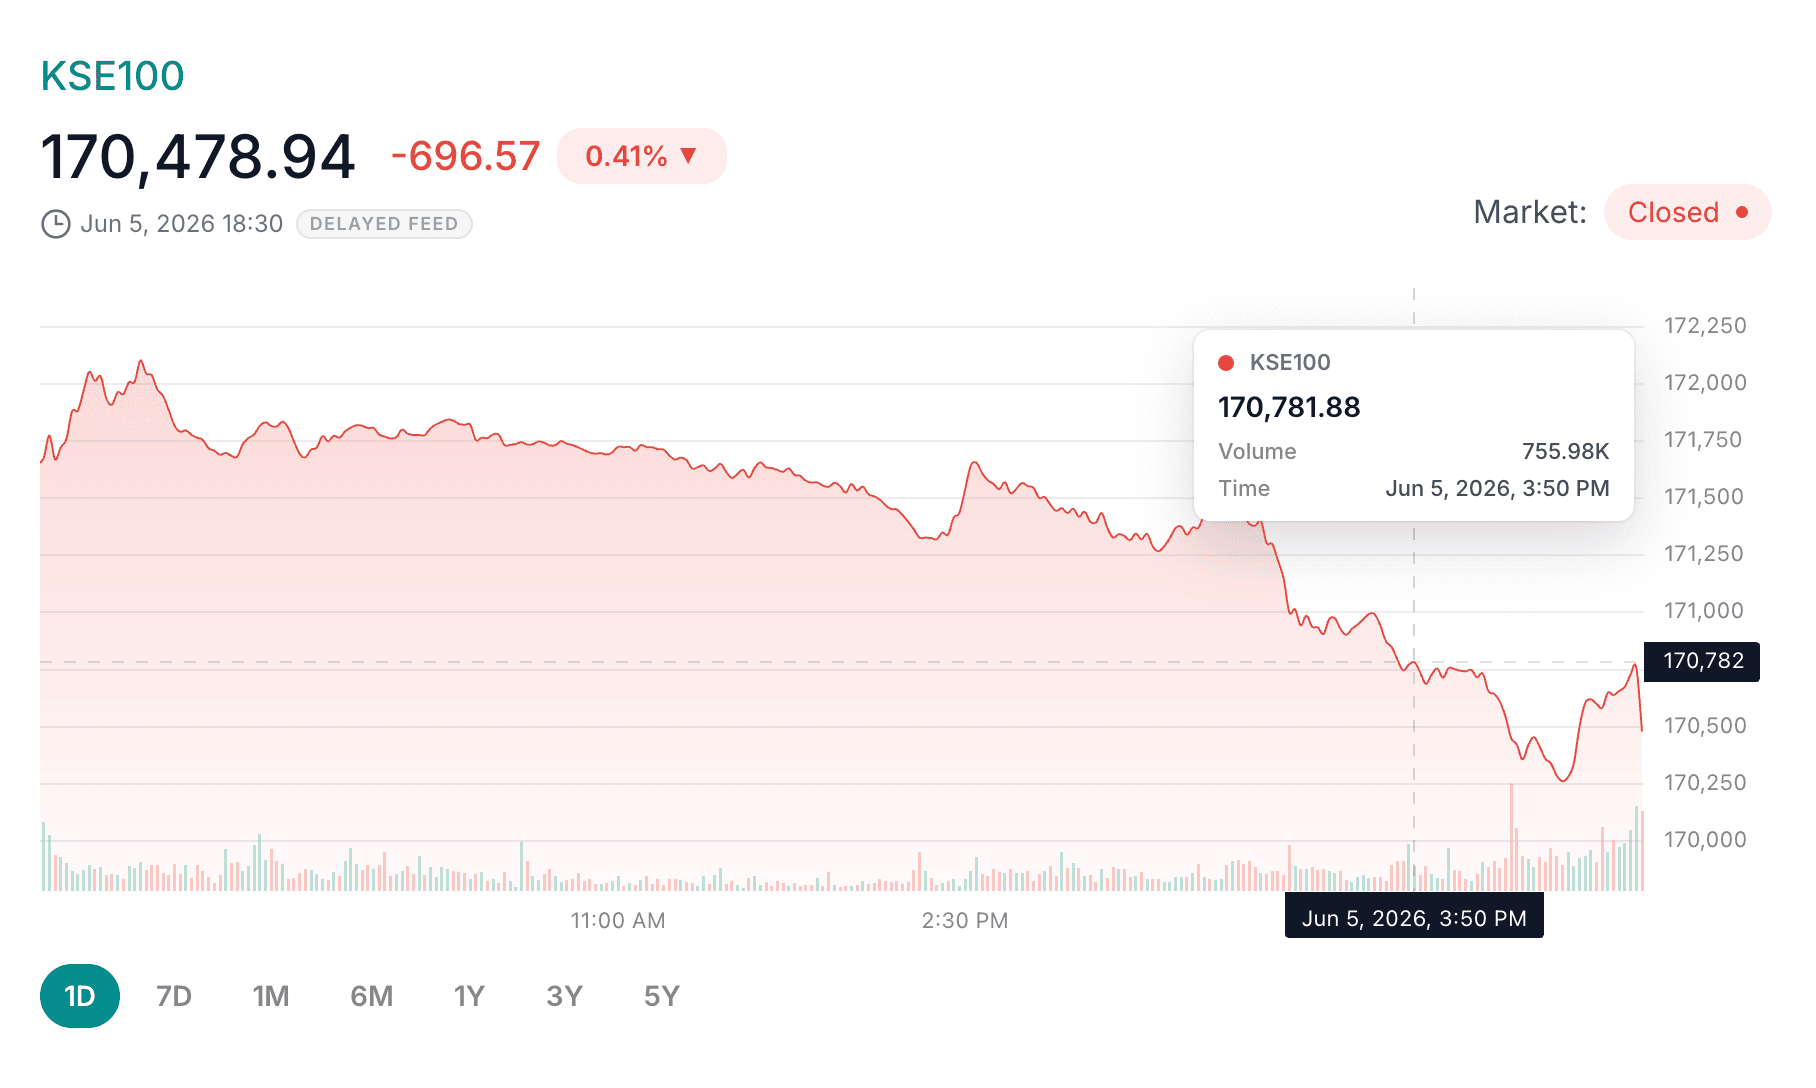
How to Read Stock Charts and Market Trends on PSX
Learn how to read PSX stock charts, price trends, volume bars, timeframes, day range and technical indicators without treating charts as guaranteed predictions.
Read guide
Common Mistakes Beginners Make in the Pakistan Stock Exchange
A practical guide to common PSX beginner mistakes, including chasing tips, overtrading, ignoring risk, skipping research and not tracking portfolio decisions.
Read guide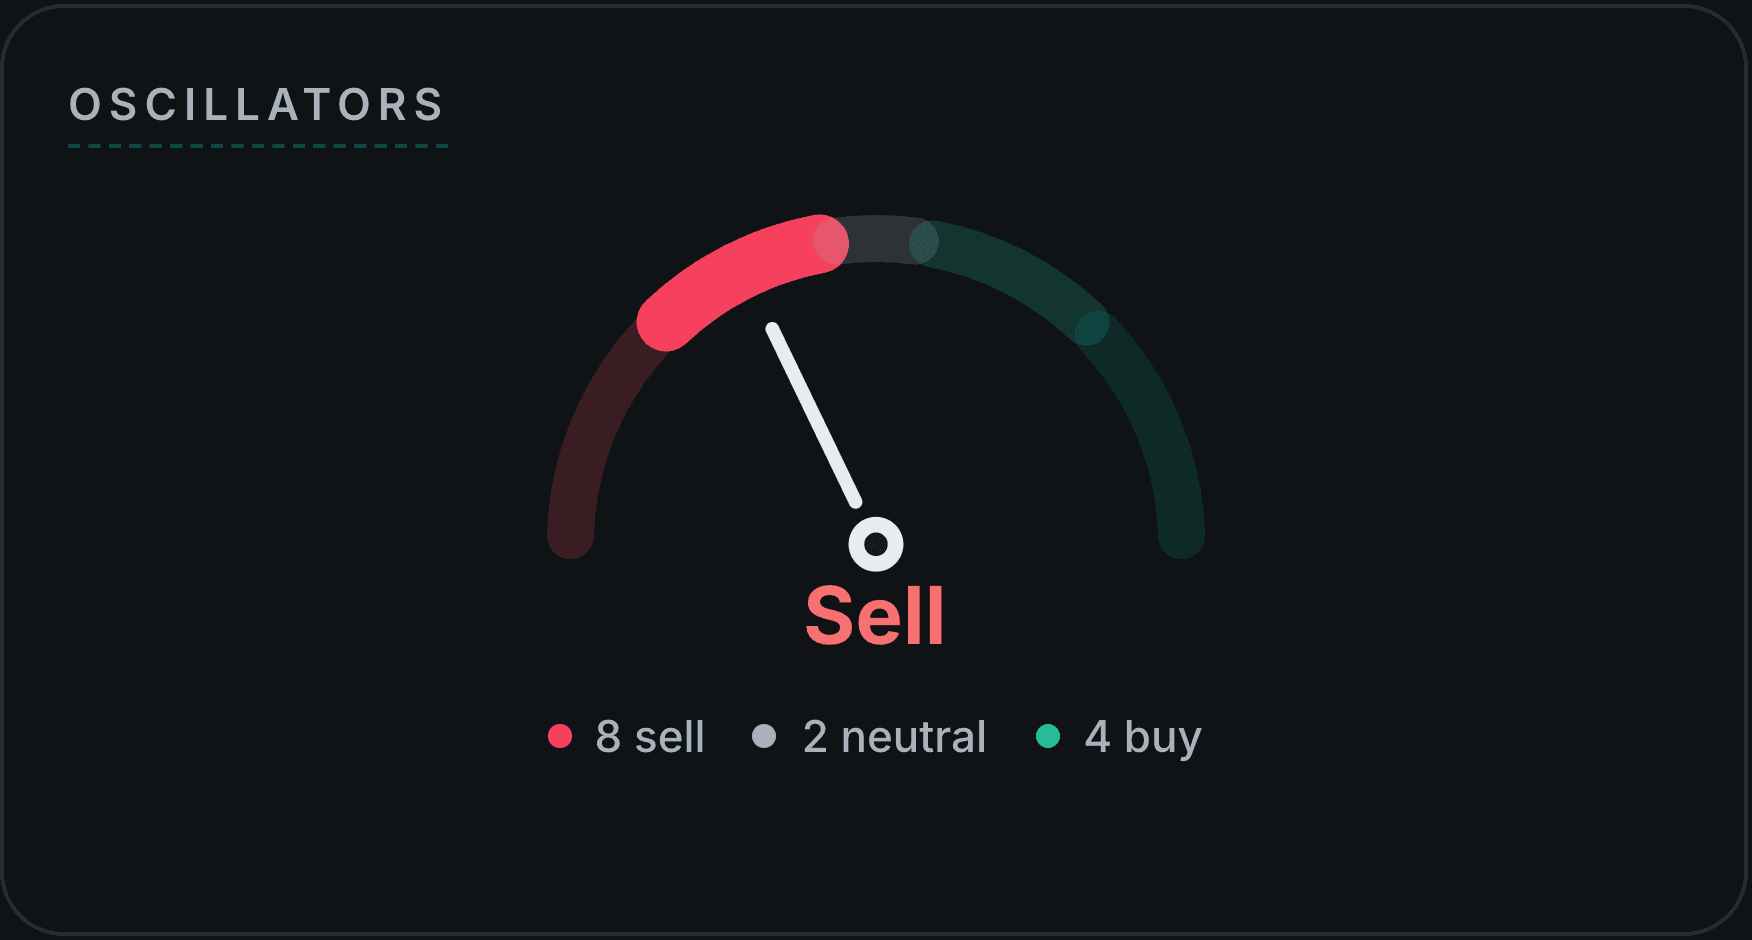
How to Read the Technicals Tab on Investify: A Beginner's Guide
A detailed, section-by-section guide to Investify's Technicals tab for PSX stocks: the buy/sell verdict gauges, Standouts, pivots and ranges, volume, every oscillator (RSI, MACD, Stochastic, ADX and more), moving averages, Bollinger Bands and ATR, all explained in plain English.
Read guide