
Position Size Calculator
YOUR TRADE
How many shares, for the loss you can take
That is Rs 10,000 if your stop is hit. Many traders keep it between 0.5% and 2%.
Market price is not available, so this is an example. Enter your own price.
Stop price Rs 380.00.
Waiting for a market price for LUCK. Until it arrives, or if the symbol is not listed, the numbers below use an example price. Type your own price to override it.
BUY
500shares of LUCK
at Rs 400.00: a Rs 200,000 position. If the stop at Rs 380.00 is hit you lose Rs 10,000.
EntryRs 400.00
500 shares
StopRs 380.00
-5%, lose Rs 10,000
OTHER RISK LEVELS
The same trade at 0.5% to 3% risk
WHERE YOU TAKE PROFIT
Add a target
A target twice or three times the stop distance (2R, 3R) means you can be wrong more often than right and still come out ahead.
0 means no target.
How the position size is worked out
Most beginners decide how much money to put in a stock. Position sizing flips it: decide how much you can lose, then let the stop-loss tell you how big the position can be. Three numbers go in, the risk budget, the entry and the stop, and one comes out.
- Risk budget
- account size × risk %, or a rupee amount you choose
- Entry − stop
- what each share loses if the stop is hit
- c
- one leg's trading cost: half the round-trip percentage
The result is rounded down to a whole lot, so the real risk never creeps above your budget. Then two checks run: the position cannot be larger than your cash (the calculator assumes no leverage), and you are warned when one stock would take too big a share of the account.
A worked example
Account Rs 1,000,000, risk 1% (so a Rs 10,000 budget), entry Rs 200, stop-loss 5% below at Rs 190. Each share can lose Rs 10, so you buy 1,000 shares: a Rs 200,000 position, 20% of the account. Add 0.37% round-trip costs and the loss per share rises to Rs 10.72, so the size falls to 932 shares.
The same budget at different stop distances shows why the stop comes first:
| Stop below entry | Loss per share | Shares | Position | Share of account |
|---|---|---|---|---|
| 2% | Rs 4.00 | 2,500 | Rs 500,000 | 50% |
| 5% | Rs 10.00 | 1,000 | Rs 200,000 | 20% |
| 8% | Rs 16.00 | 625 | Rs 125,000 | 13% |
| 10% | Rs 20.00 | 500 | Rs 100,000 | 10% |
A 2% stop looks safe but buys 2,500 shares, half the account in one stock. On a smaller account the cap bites: with Rs 100,000, a 5% risk and a 2% stop, risk alone calls for 1,250 shares (Rs 250,000), but only 500 fit in the account, so the calculator caps it and shows you the smaller real risk.
PSX facts that change the sizing
- One-share lot. Since 2024 the regular market trades in any quantity, so you can size precisely, even on a small account. ETFs, deliverable futures and IPO bookings keep 500-share lots.
- Daily limits can trap a stop. A stock can move 10% either way in a day (or Re. 1 for stocks priced under Rs 10). If it locks lower you may not be able to sell, so your loss can be bigger than planned. Look up today's limits with the upper and lower lock calculator.
- Costs add up on tight stops. The tighter the stop, the larger the share of your risk budget that fees take. See the full list in PSX trading fees and charges and price a trade with the brokerage calculator.
- Your cash is the ceiling. The calculator assumes your own money. Some brokers offer margin financing, which raises risk and is not modelled here.
Common sizing mistakes
- Sizing by rupees, not by risk. "I will put Rs 200,000 in every trade" means a different loss every time. Fix the loss, not the amount.
- Moving the stop after you buy. Widening a stop to avoid being hit turns a Rs 10,000 risk into a bigger loss. Decide the stop first and keep it.
- Stacking correlated stocks. Three oil and gas names are closer to one position than three. Count them together against your limits.
- Ignoring the reward. A good size on a bad trade is still a bad trade. Check the payoff with the risk reward calculator, and if you add to a loser, see where your average lands with the stock average calculator.
Choosing the risk percentage and the stop
The calculator answers how many shares, but two inputs are yours to choose, and they matter more than the arithmetic. The risk percentage sets how hard a losing streak hits: at 1% a run of five losses costs about 5% of the account, at 3% it costs about 14%. New traders usually do better starting near the bottom of the 0.5% to 2% range and raising it only after a track record.
The stop belongs where the trade idea fails, not where it happens to give a round number of shares. Look at the chart for a recent swing low or support level (the pivot point calculator and Fibonacci calculator can mark candidates), then enter that price as the stop and let the position size follow. If the resulting position is too big for your account, the answer is a smaller risk or a different trade, not a tighter stop.
Sources and assumptions
Lot size and price-limit rules checked October 31, 2026.
- PSX notice N-327 (April 15, 2024): one-share lot on the regular market
- PSX notice N-477 (May 20, 2024): security-wise circuit breakers raised to 10% or Re. 1
- PSX data portal, prices
- Calculation: shares = risk ÷ (|entry − stop| + c × (entry + stop)), rounded down to the lot, where c is half the round-trip cost
Position sizing limits how much a trade can cost you if you act on your stop. It does not predict whether a trade wins. Results are estimates for information and planning only, not tax, legal or investment advice. Check your own case with a tax adviser, your broker or the official source before acting.
FAQ
Position Size Calculator: common questions
What is position sizing?+
Position sizing is deciding how many shares to buy before you buy them, so that a loss on the trade stays within an amount you picked in advance. You choose the risk first (say 1% of your account), mark where you would admit the trade is wrong (the stop-loss), and the share count follows from the gap between the two prices.
How do I calculate how many shares to buy?+
Shares = money you are willing to risk ÷ loss per share at your stop. With Rs 10,000 at risk, an entry of Rs 200 and a stop of Rs 190, the loss per share is Rs 10, so you buy 1,000 shares. With trading costs switched on (under More options) the calculator also adds the cost of the buy and the sell to the loss per share, so the real loss at the stop stays inside your budget.
How much of my account should I risk on one trade?+
There is no single right answer, and this is not advice. Many traders keep it between 0.5% and 2% of the account, so a string of losses cannot do lasting damage. At 1% risk, ten losing trades in a row cost roughly a tenth of the account. Pick a number you can sit through, and keep it the same across trades.
Why does a tighter stop-loss give a bigger position?+
Because the risk budget is fixed. If each share can only lose Rs 4 instead of Rs 10, the same Rs 10,000 budget buys 2,500 shares instead of 1,000. That is not safer: a very tight stop gets hit by ordinary price noise, and the larger position ties up more capital. Place the stop where the trade idea is wrong, then size from it.
Does the calculator include brokerage and taxes?+
With trading costs switched on under More options it adds a round-trip trading cost (0.37% of turnover by default, struck on a Rs 100,000 trade) to the loss per share, covering commission, sales tax on it, and the PSX, SECP, NCCPL and CDC charges on both legs. Shares priced under about Rs 20 cost more, because brokers charge at least Rs 0.03 a share. Capital gains tax applies to profits, not to the loss at your stop, so it is not part of the sizing. By default costs are left out. For exact fees on a given trade use the brokerage calculator.
What if a stock locks at its lower limit and my stop cannot fill?+
A stop-loss is not a guarantee. PSX stocks can fall by their daily limit (10%, or Re. 1 for stocks below Rs 10) and, if buyers disappear, you may be unable to sell at all that day. Your real loss can then exceed the planned loss. Keep position sizes modest for illiquid or volatile stocks, and check the limits with the upper and lower lock calculator.
What lot size does the PSX regular market use?+
One share. PSX converted regular-market stocks to a one-share lot during 2024, so any quantity is allowed. ETFs, deliverable futures contracts and IPO bookings still use 500-share lots, which you can select under More options.
Can I short sell on PSX?+
Short selling exists but is limited. It needs your broker to arrange the shares and meet exchange conditions, and many retail accounts do not offer it. The calculator includes a short option under More options so the maths is available, but most investors on PSX buy first and sell later.
Keep going
Related tools
Risk Reward & Stop Loss Calculator
Risk to reward ratio, stop-loss and target prices, and the win rate a setup needs.
PSX Brokerage & Trading Profit Calculator
Every fee on a PSX trade (commission, sales tax, CDC, NCCPL, SECP) and your net profit and break-even.
Stock Average Price Calculator
Your average cost after several buys, and how many shares bring it down to a target.
PSX guides
Learn the ideas behind the numbers

Common Mistakes Beginners Make in the Pakistan Stock Exchange
A practical guide to common PSX beginner mistakes, including chasing tips, overtrading, ignoring risk, skipping research and not tracking portfolio decisions.
Read guide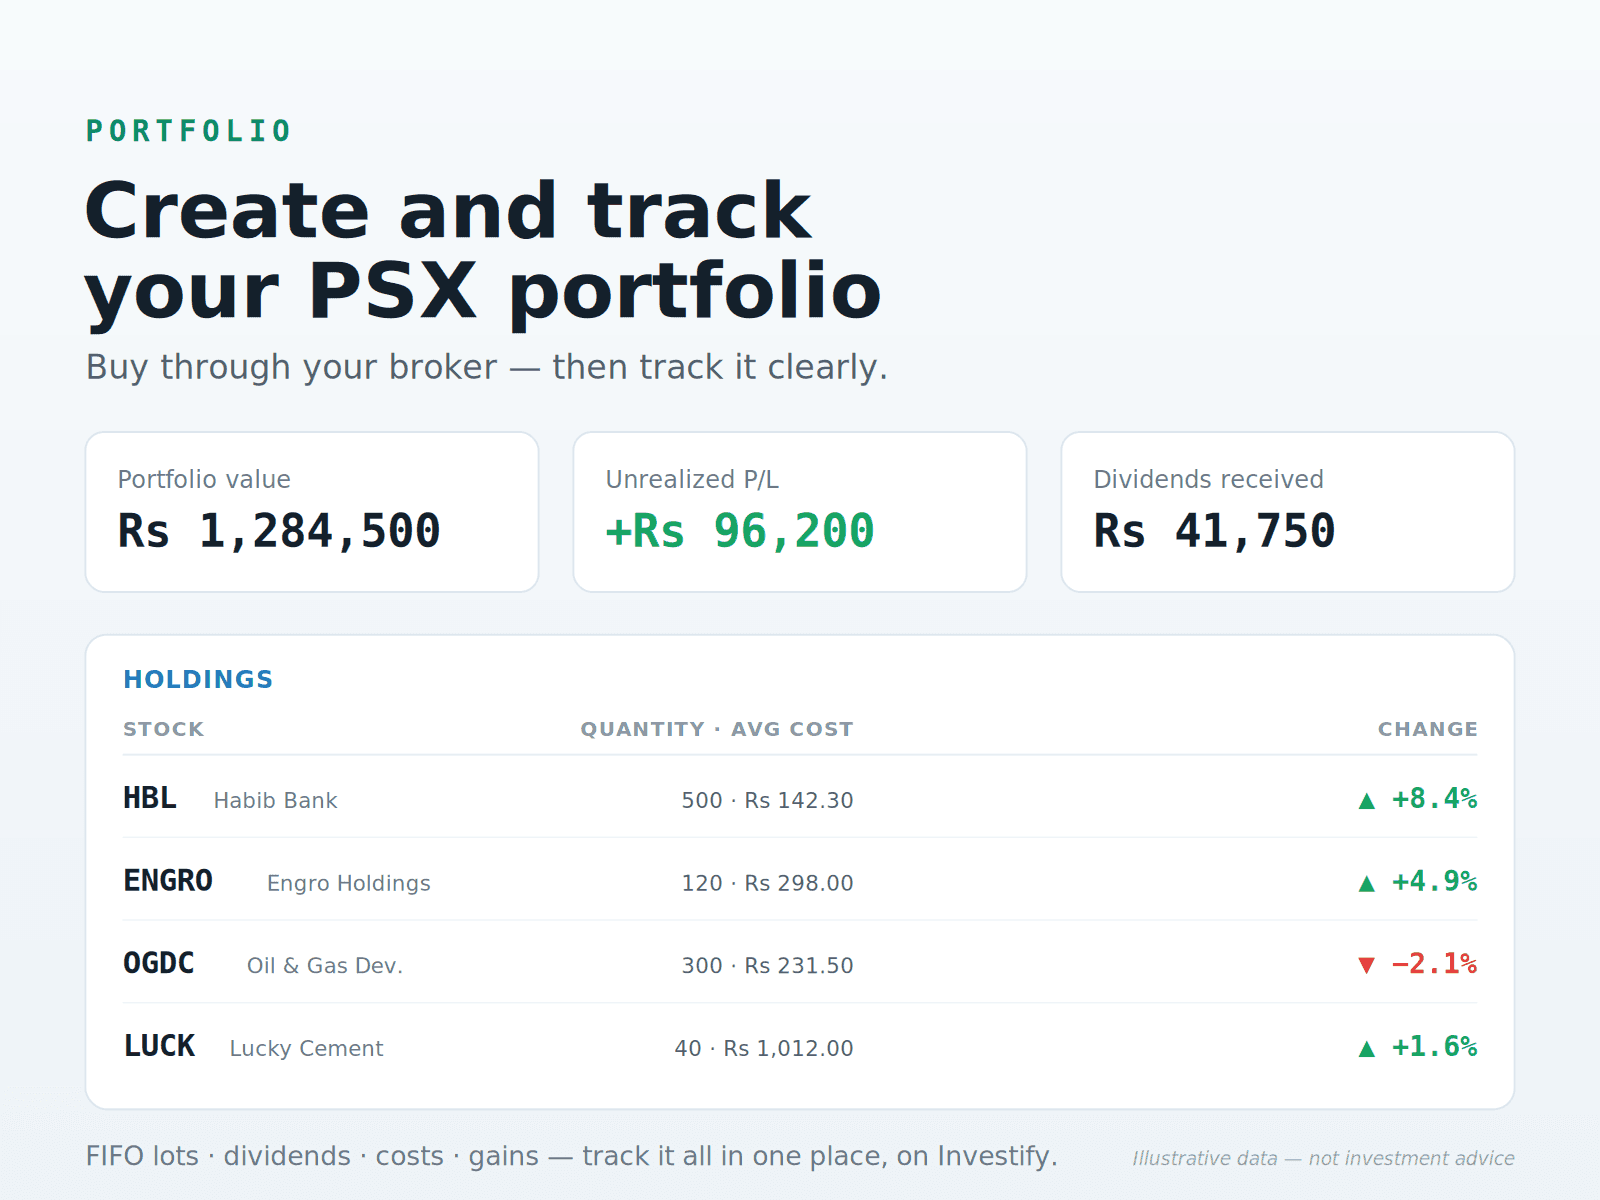
How to Create and Track a PSX Stock Portfolio
Learn how to create a PSX stock portfolio through a licensed broker and track it with FIFO, dividends, costs and corporate actions.
Read guide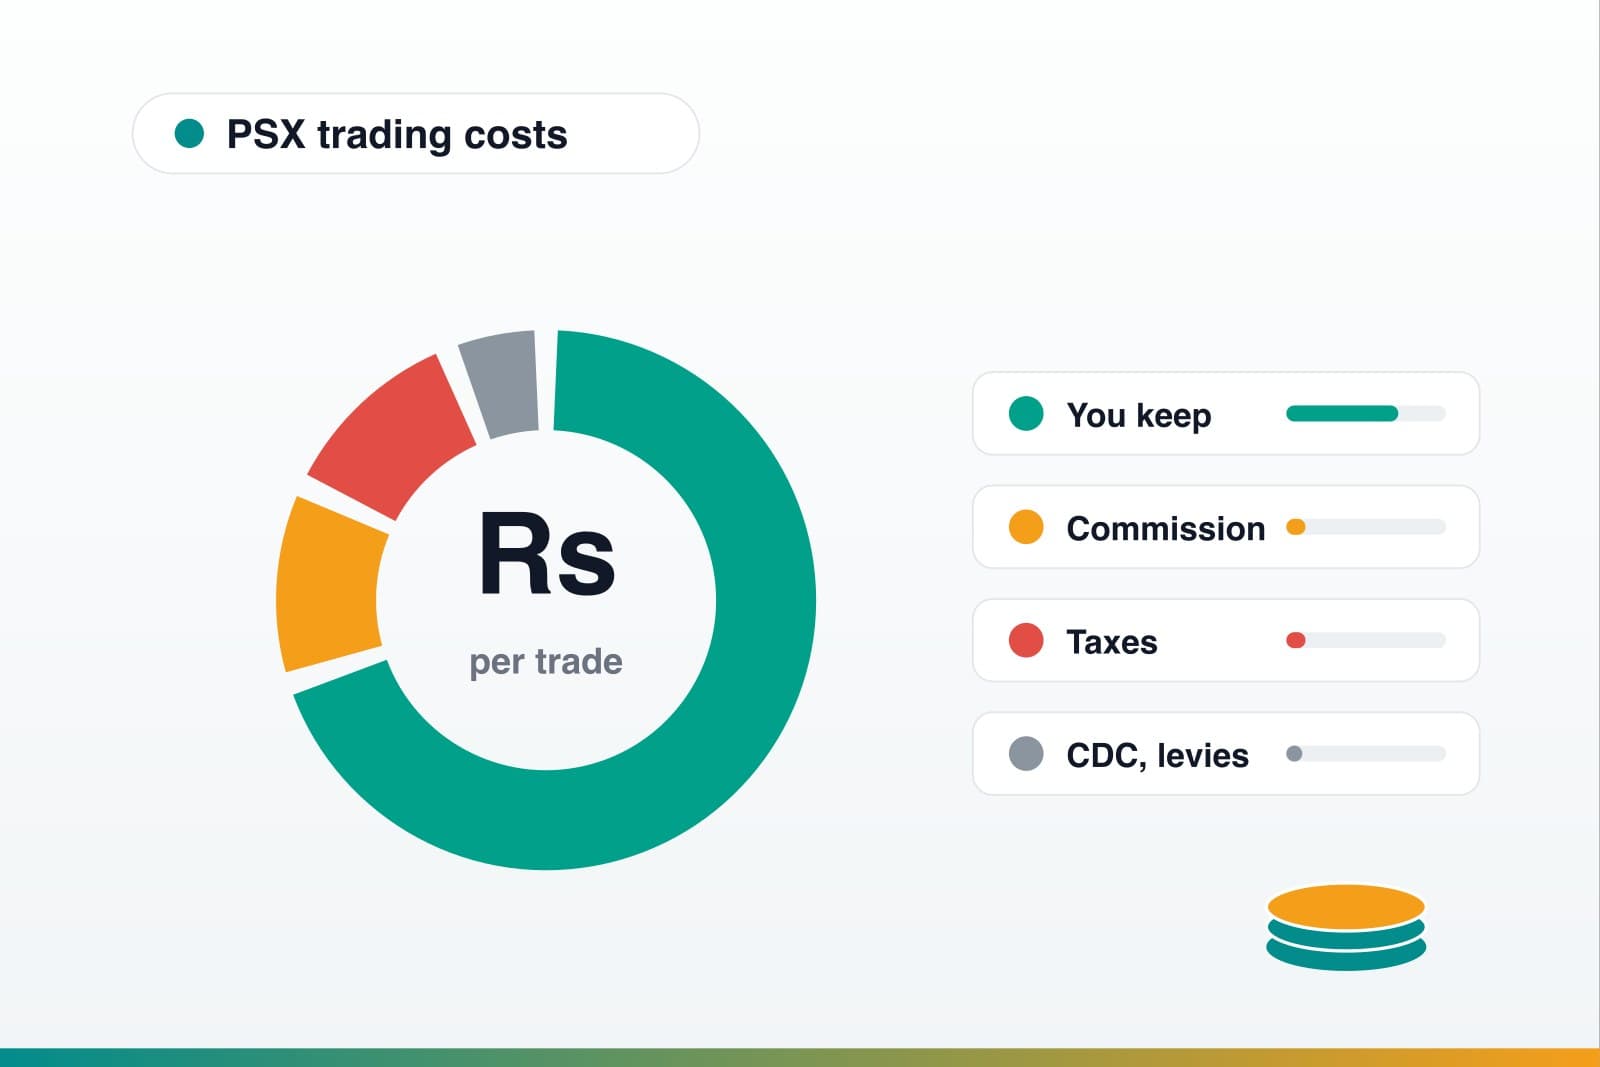
PSX Trading Fees & Charges: What a Trade Actually Costs in Pakistan
Every fee on a PSX trade explained - brokerage commission structures, sales tax on commission, CDC and NCCPL charges, regulatory levies and taxes - with a worked example of a full Rs 100,000 buy-and-sell round trip.
Read guide