Brent crude
Front-month futures · global benchmark
$104.31/ barrel
At its 30 day low · $104 to $136
- Per barrel in rupees
- Rs 28,832
- Per litre of crude
- Rs 181.35
Last quote 3:00 AM PKT, November 3, 2026

Brent · WTI · Dubai
Per barrel, in dollars and rupees. Tuesday, November 3, 2026
Front-month futures · global benchmark
$104.31/ barrel
At its 30 day low · $104 to $136
Last quote 3:00 AM PKT, November 3, 2026
Front-month futures · US benchmark
$97.70/ barrel
Mid range · $85 to $110
Brent crude was $104.31 a barrel on November 3, 2026, or about Rs 28,832 per barrel (Rs 181.35 per litre of crude) at USD/PKR 276.41. WTI crude was $97.70 a barrel. Brent is not trading right now, so its price is the last trade (3:00 AM PKT); WTI is trading live.
Chart
Brent change
+$38.52 (+58.5%)
since 03/11/2025
Brent high
$138.21
on 07/04/2026
Brent low
$59.93
on 16/12/2025
WTI change
+$35.91 (+58.1%)
since 03/11/2025
WTI high
$114.58
on 07/04/2026
WTI low
$55.44
on 16/12/2025
Recent days are Investify's daily closes of the front-month futures quote. Older days are the U.S. Energy Information Administration's daily spot prices (Max goes back to 1987), so the line can step where the two meet. Prices are in US dollars, not adjusted for inflation.
Oil in rupees
Per barrel
Rs 28,832
Per litre
Rs 181.35
Per 1,000 litres
Rs 181,350
Rupees per litre = dollar price × USD/PKR ÷ 158.987 litres in a barrel.
A litre of crude is not a litre of petrol. The pump price also carries the cost of refining and of petrol itself, freight and storage, oil company and dealer margins, the petroleum levy, the climate support levy and sales tax.
Brent crude, per litre
Rs 181.35
Petrol at the pump, effective November 3, 2026
Rs 374.51
Crude is converted at the live rate and price; the petrol price is the maximum ex-depot price notified by OGRA.
Pakistan's benchmarks
Dubai crude
$105.30
-11.29%per barrel · Close 02/11/2026
Petrol (gasoline 92 RON)
$104.05
-7.26%per barrel · Close 02/11/2026
Diesel (gasoil 10 ppm)
$147.84
-1.98%per barrel · Close 02/11/2026
State Bank USD/PKR
Rs 276.86
Weighted average, 02/11/2026
| Date | Dubai crude | Petrol 92 | Diesel | SBP rate (Rs) |
|---|---|---|---|---|
| Seven-day average, used for the price effective 03/11/2026 | 114.31 | 118.62 | 153.79 | 276.92 |
| 02/11/2026 | 105.30 | 104.05 | 147.84 | 276.86 |
| 30/10/2026 | 118.70 | 112.19 | 150.82 | 276.90 |
| 29/10/2026 | 114.20 | 119.65 | 148.06 | 276.90 |
| 28/10/2026 | 114.20 | 123.05 | 151.45 | 276.92 |
| 27/10/2026 | 115.10 | 126.44 | 159.86 | 276.95 |
| 26/10/2026 | 115.74 | 124.09 | 157.70 | 276.96 |
| 23/10/2026 | 116.90 | 120.86 | 160.82 | 276.96 |
| 22/10/2026 | 115.40 | 117.61 | 156.82 | 277.00 |
| 21/10/2026 | 110.98 | 117.24 | 160.23 | 277.01 |
| 20/10/2026 | 110.70 | 119.70 | 159.24 | 277.01 |
Platts assessments as published by OGRA. State Bank rate as printed in the same data.
OGRA's daily petrol and diesel prices are based on a rolling average of the last seven working days of the Platts Arab Gulf petrol and diesel assessments, converted at the State Bank rate. Margins, the petroleum levy, the climate support levy and sales tax are then added. Dubai crude is the crude benchmark OGRA prints beside them. A move in these numbers reaches the pump over the following days.
How the petrol price is builtCommodity board
Brent crude oil
Front-month futures quote
$104.31per barrel
Rs 181.35 per litre
03/11/2026, 3:00 AM PKT
WTI crude oil
Front-month futures quote
$97.70per barrel
Rs 169.86 per litre
03/11/2026, 3:01 PM PKT
Dubai crude oil
Platts assessment, as published by OGRA
$105.30per barrel
-11.29%Rs 183.07 per litre
Close 02/11/2026
Petrol (gasoline 92 RON), Arab Gulf
Platts assessment, as published by OGRA
$104.05per barrel
-7.26%Rs 180.90 per litre
Close 02/11/2026
Diesel (gasoil 10 ppm), Arab Gulf
Platts assessment, as published by OGRA
$147.84per barrel
-1.98%Rs 257.03 per litre
Close 02/11/2026
Natural gas (Henry Hub)
NYMEX futures close, via PMEX
$2.880per MMBtu
-1.03%Close 30/10/2026
LNG, Japan import price
World Bank, monthly average
$14.25per MMBtu
-6.68%Sep 2026 average
Natural gas, Europe (TTF)
World Bank, monthly average
$25.42per MMBtu
+20.42%Sep 2026 average
Coal, Australia (Newcastle)
World Bank, monthly average
$147.10per tonne
+8.80%Rs 40,660 per tonne
Sep 2026 average
Coal, South Africa (Richards Bay)
World Bank, monthly average
$98.20per tonne
+1.45%Rs 27,143 per tonne
Sep 2026 average
Platinum
$1,428per ounce
03/11/2026, 3:00 PM PKT
Palladium
$962.00per ounce
03/11/2026, 3:01 PM PKT
Copper
$6.494per pound
Rs 3,957 per kg
03/11/2026, 3:01 PM PKT
Aluminium
Futures close, via PMEX
$3,163per tonne
-0.47%Rs 874,147 per tonne
Close 30/10/2026
$3,910per ounce
-0.94%03/11/2026, 3:01 PM PKT
$49.12per ounce
-3.26%03/11/2026, 3:01 PM PKT
Cotton, Karachi spot rate
Karachi Cotton Association, per maund of 37.324 kg
Rs 18,080per maund
0.00%Rs 18,080 per maund
Close 02/11/2026
Cotton (ICE No. 2)
Futures close in US cents per pound, via PMEX
77.85¢per pound
-0.75%Rs 17,707 per maund
Close 30/10/2026
Palm oil
World Bank, monthly average
$1,180per tonne
+4.24%Rs 326.16 per kg
Sep 2026 average
Soybean oil
World Bank, monthly average
$1,615per tonne
-1.46%Rs 446.40 per kg
Sep 2026 average
Wheat (CBOT)
Futures close in US cents per bushel, via PMEX
605.50¢per bushel
+0.21%Rs 2,460 per 40 kg
Close 30/10/2026
Corn (CBOT)
Futures close in US cents per bushel, via PMEX
448.75¢per bushel
-0.66%Rs 1,953 per 40 kg
Close 30/10/2026
Soybeans (CBOT)
Futures close in US cents per bushel, via PMEX
1,238¢per bushel
+0.49%Rs 5,029 per 40 kg
Close 30/10/2026
Sugar, world
World Bank, monthly average
$0.410per kg
+7.89%Rs 113.33 per kg
Sep 2026 average
Urea
World Bank, monthly average
$407.50per tonne
+4.49%Rs 5,632 per 50 kg bag
Sep 2026 average
DAP
World Bank, monthly average
$800.60per tonne
+0.89%Rs 11,065 per 50 kg bag
Sep 2026 average
Rupee equivalents are world prices converted at USD/PKR 276.41. Local market prices also include duties, freight and margins, so they differ. Change compares with the previous close, or with the previous month for monthly rows. Live quotes are indicative.
What it means for Pakistan
Pakistan prices petrol and diesel every working day from Platts Arab Gulf product prices, which follow crude. OGRA uses a rolling seven-working-day average, so a sharp move in crude reaches the pump over days, not at once, and taxes and margins stay in the price either way. Petrol is Rs 374.51 per litre today. How the price is built.
Pakistan imports most of the oil it uses, so petroleum is one of the largest items in its import bill. A higher oil price means more dollars leave the country for the same barrels, which adds pressure on reserves and the rupee; a lower price eases it. A one-dollar move in Brent changes the cost of a barrel by about Rs 276 at today's rate. Exports, remittances and loan flows matter just as much, so oil alone does not decide the exchange rate.
Part of Pakistan's power is generated from furnace oil and imported LNG (RLNG), whose prices follow oil and world gas markets. Changes in fuel cost reach consumers through the monthly fuel charges adjustment on bills. LNG delivered to Japan averaged $14.25 per MMBtu in September 2026. Gas and coal prices are on the commodity board.
Pakistan imports most of its edible oil, mainly palm oil, paid for in dollars. Palm oil averaged $1,180 a tonne in September 2026, about Rs 326 per kg at the interbank rate. Shop prices also include duties, freight and margins, so they move with the world price and the rupee, with a delay.
Cotton is the main raw material of Pakistan's textile industry, the country's largest export sector. The Karachi spot rate is Rs 18,080 per maund. World cotton closed at 77.85 US cents per pound. Oil matters here too: polyester competes with cotton, and energy is a large part of mill costs.
Pakistan makes urea at home, mainly from natural gas, so its cost follows local gas supply and pricing more than world oil. DAP is largely imported and follows the world price. World urea averaged $407.50 a tonne in September 2026. Fertilizer costs reach food prices through the crop cycle, not within days.
Oil and the PSX
They sell the crude oil and gas they produce, so their revenue tends to follow oil prices, gas prices and the rupee.
They buy crude and sell petrol, diesel and other products. Their margins depend on the gap between product prices and crude cost, and on government pricing rules, not on crude alone.
They buy fuel and sell it through pumps. Their per-litre margins are set inside the pricing formula, so oil prices reach them through sales volumes, stock values and financing needs.
This list is for general information and is not investment advice. Each company reacts to oil prices differently, and prices of shares depend on much more than oil.
Oil news
Questions
Sources
Brent, WTI, platinum, palladium, copper, gold and silver are quoted every minute while their markets are open. Brent and WTI are front-month futures quotes, so they are indicative and can differ from an exchange settlement price. The market state and the time of the last quote, in Pakistan time, are shown beside each price.
The U.S. Energy Information Administration (EIA) publishes Brent and WTI spot prices as public data, with a delay of about a week. Spot prices (physical barrels) and futures prices (a contract for later delivery) are different measures. The chart for long ranges uses the EIA series back to 1987.
Dubai crude and the Platts Arab Gulf petrol (gasoline 92 RON) and diesel (gasoil 10 ppm) assessments, and the State Bank rate, are as published by OGRA in its daily Platts data.
Natural gas, aluminium, ICE cotton, wheat, corn and soybeans are futures closes from the Pakistan Mercantile Exchange. Cotton spot is the Karachi Cotton Association rate. Coal, LNG, European gas, palm oil, soybean oil, sugar, urea and DAP are monthly averages from the World Bank Commodity Price Data (the Pink Sheet), published early each month.
We convert world prices at the interbank USD/PKR rate shown on the page: rupees per barrel is the dollar price times the rate, per litre divides by 158.987 litres, per maund uses 37.324 kg, and the other local units use their standard weights. These are conversions of world prices, not local market prices, which also include duties, freight and margins.
Live quotes are indicative and may differ from exchange prices. Information on this page is for general information, is not investment advice, and is not a forecast. Fuel prices: Oil and Gas Regulatory Authority (OGRA) price notifications. Platts assessments as published by OGRA. Official daily spot: U.S. Energy Information Administration. Monthly prices: World Bank Commodity Price Data (The Pink Sheet). Futures closes: Pakistan Mercantile Exchange. Cotton spot: Karachi Cotton Association.
PSX guides
If oil-linked shares interest you, these guides explain how to start on the Pakistan Stock Exchange.
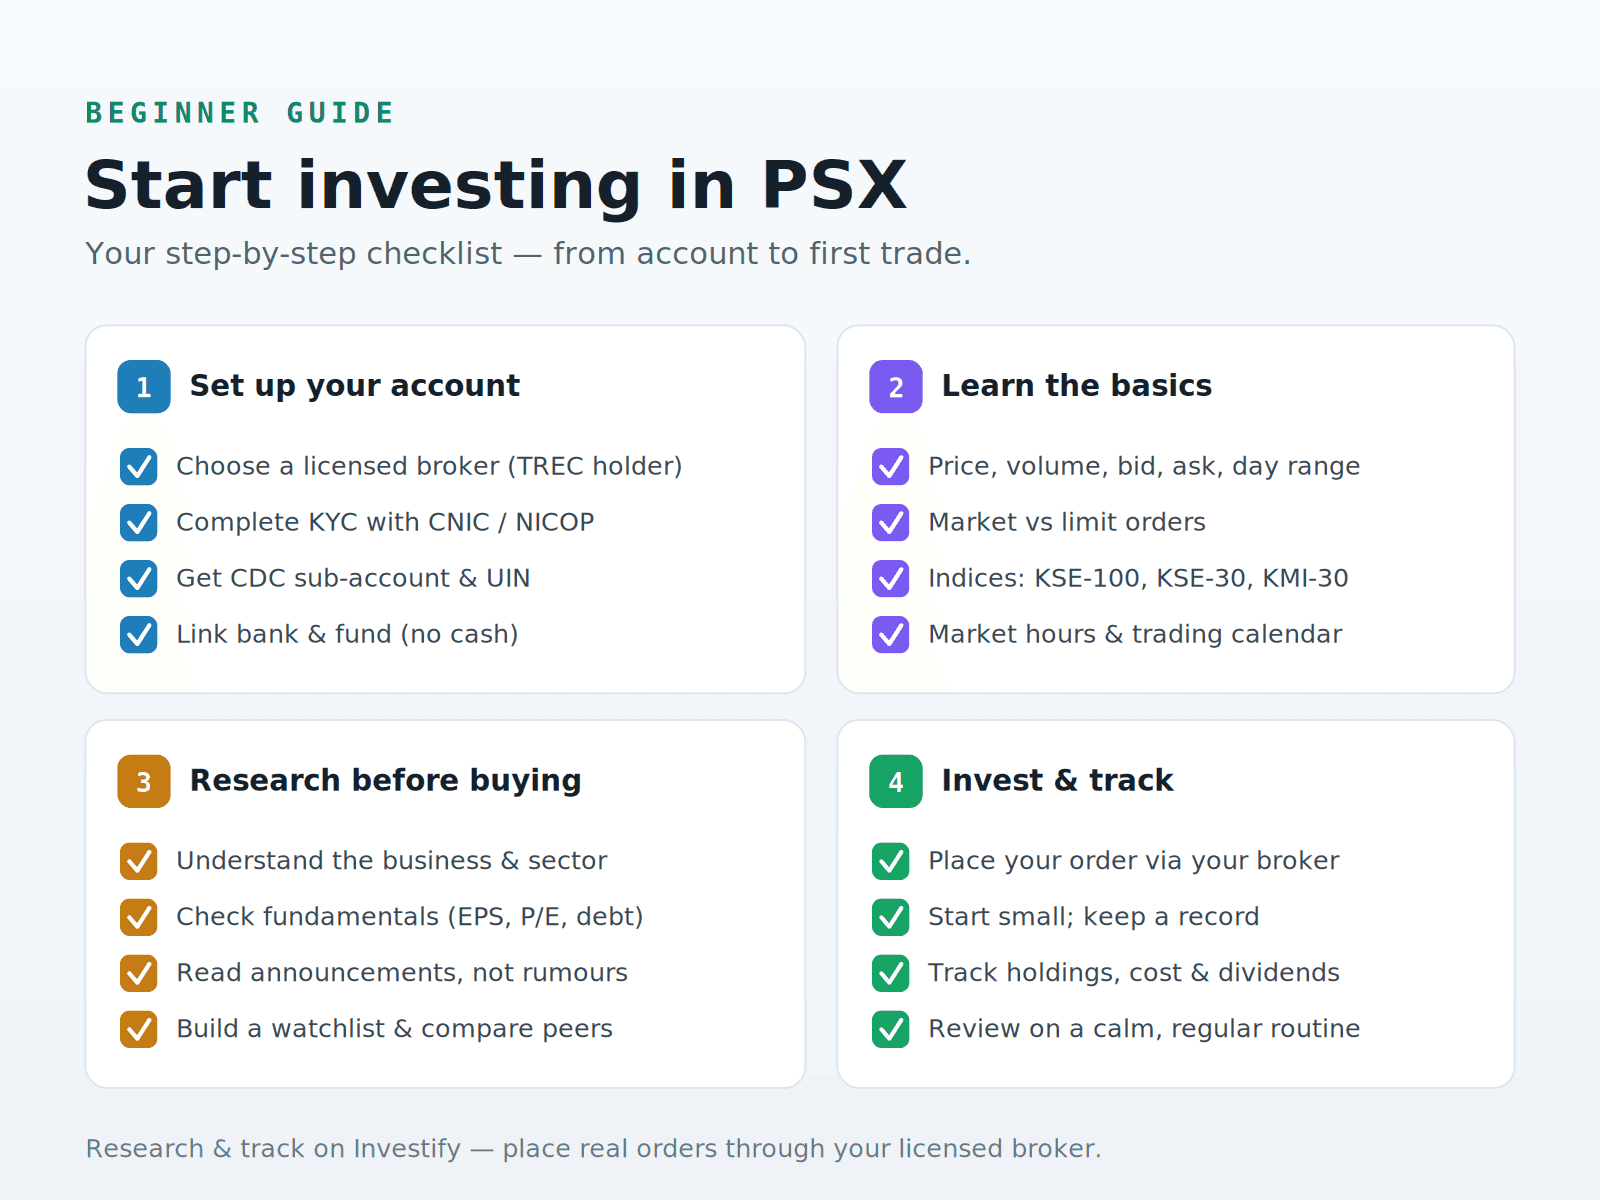
A complete beginner guide to investing in the Pakistan Stock Exchange: account setup, brokers, PSX concepts, research, risk management, portfolio tracking and daily market routines.
Read guide
Understand how much money a beginner may need to start investing in the Pakistan Stock Exchange, including account requirements, share prices, charges and practical starting ranges.
Read guide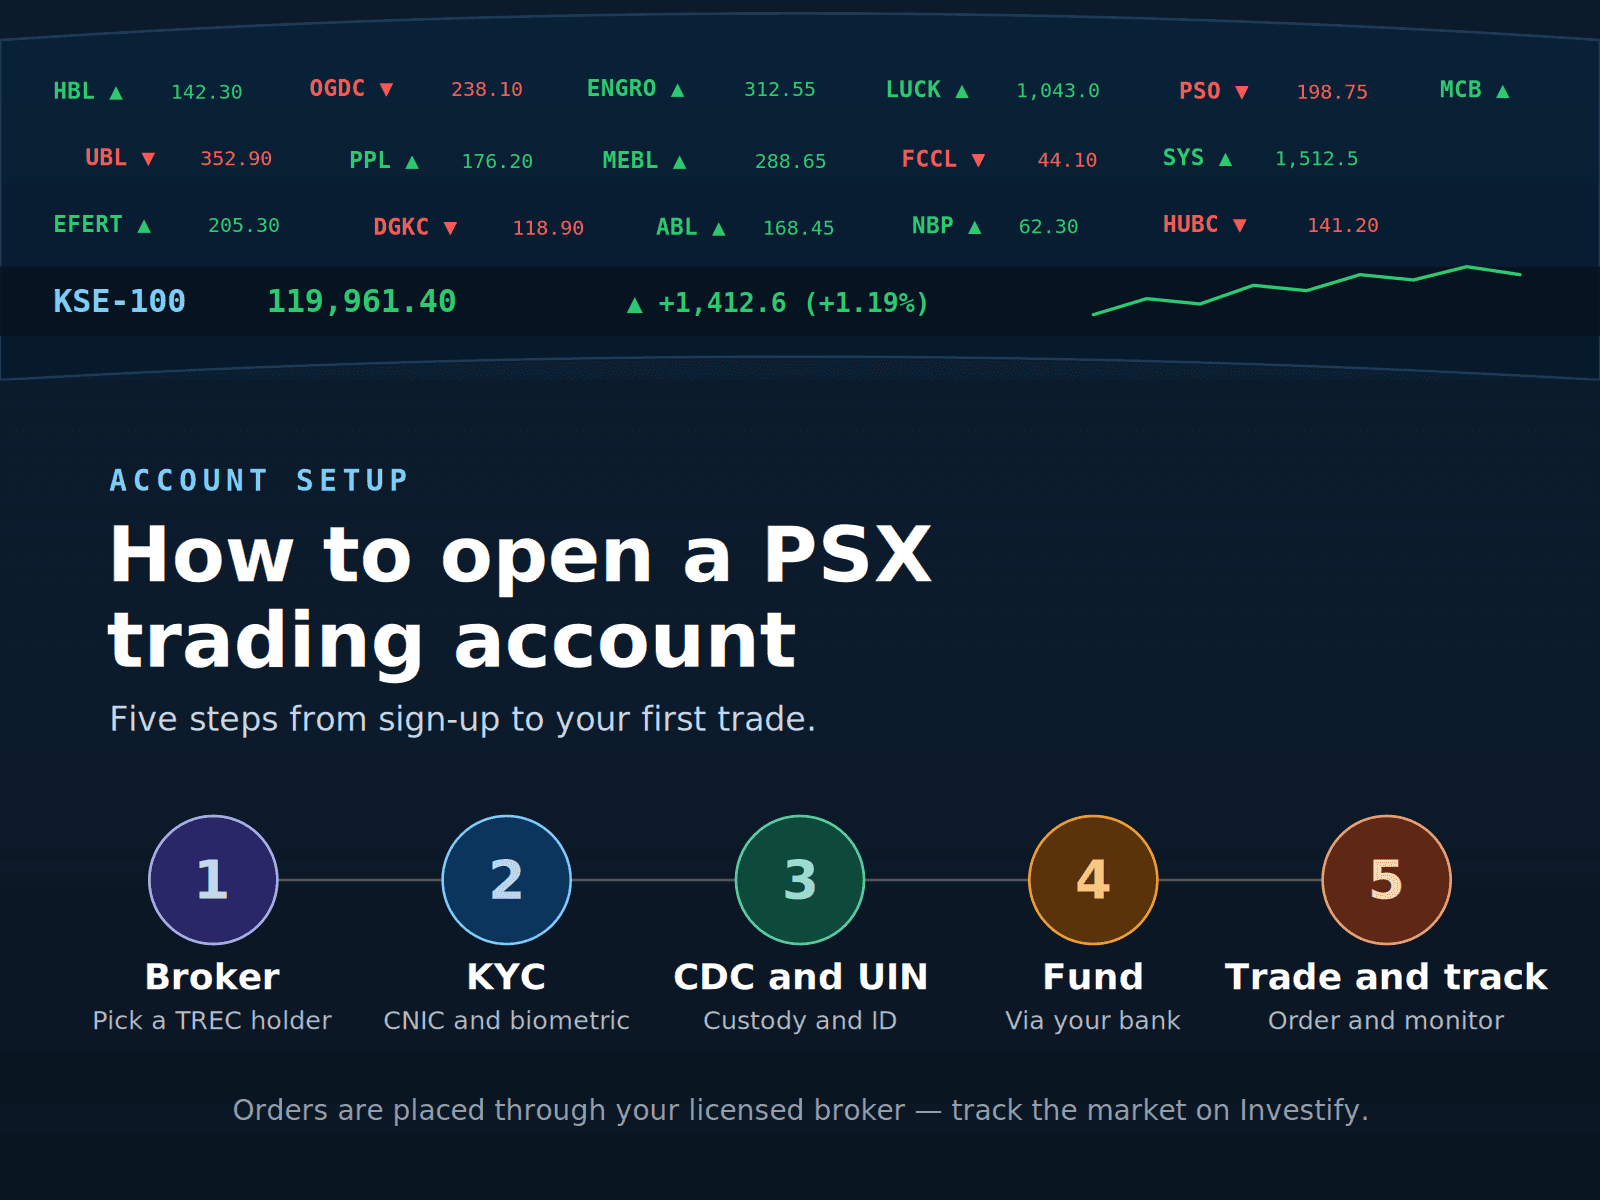
A beginner-friendly guide to opening a PSX trading account in Pakistan, including broker selection, CDC/sub-account basics, documents, KYC and what to do after account approval.
Read guideKSE-100, market breadth, the Fear & Greed meter, top movers, gold and forex.