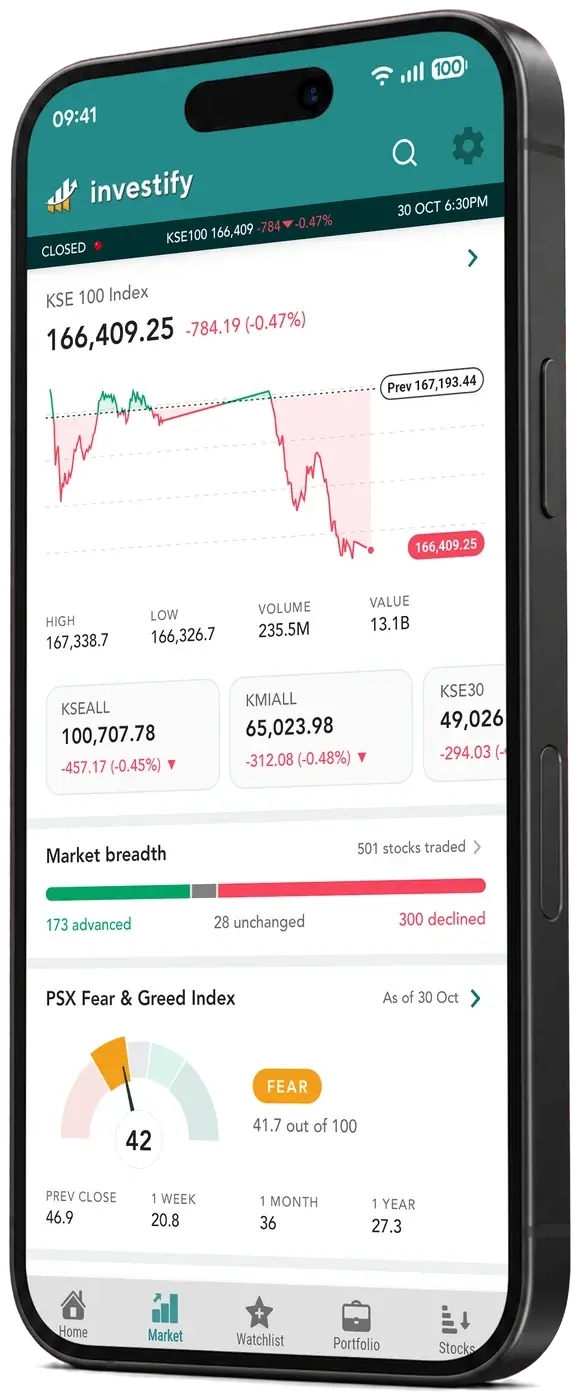

KSE 100 Index Index Level Today
The KSE 100 is PSX's free-float market capitalisation benchmark of 100 companies. Selection combines the largest eligible company in each sector with the largest remaining eligible companies. The benchmark measures total return, including cash dividend adjustments. Follow its latest available level, day change and chart below.
Snapshot
Current
177,517.74
Prev Close
178,182.95
Open
179,154.41
Volume
146.47M
Value Traded
11.86B
Constituents
100
Ranges
Day Range
Day Low
177,371.14
Day High
179,450.96
52-Week Range
52 Week Low
144,119.44
52 Week High
191,032.73
Investor tools
Run the numbers on KSE100
KSE100 Live FAQs
- What does KSE100 measure?
- The KSE 100 is PSX's free-float market capitalisation benchmark of 100 companies. Selection combines the largest eligible company in each sector with the largest remaining eligible companies. The benchmark measures total return, including cash dividend adjustments.
- What is the latest available KSE100 level?
- KSE 100 Index (KSE100) has an available level of 177,517.74 points as of 17 NOV 5:30 PM (Pakistan time). Its change from the previous close is -665.21 points (-0.37%). This is a delayed market snapshot; use the displayed timestamp to judge its freshness.
- How should I read the KSE100 level and day change?
- The KSE 100 Index level is expressed in index points. The day change compares it with the previous closing level. Use the displayed timestamp and market data status to identify the session and whether values are delayed.
- Which companies are included in KSE100?
- Open the KSE100 Constituents section for available membership, company names and links to their share-price pages. Membership can change after an index review; the index name alone does not establish the current list or each company's weight.KSE100 constituent companies
- Where can I see KSE100's historical performance?
- Use the KSE100 chart and its available date-range controls on this page to compare index levels over time. A change in index points is not the same as a percentage return, and past performance does not establish future returns.KSE100 historical chart
- Can I buy KSE100 directly on Investify?
- KSE100 is an index measure, not an order you can place in Investify. Market exposure requires underlying securities or a suitable investment product through a brokerage or fund provider. Check the product's own mandate, costs and risks; Investify provides research and portfolio tracking, not trade execution.
Methodology source: Pakistan Stock Exchange.
Data source: Market data is provided under a Pakistan Stock Exchange data license held by Recube Technologies (investify.pk), listed on the official PSX services page. Quotes, charts and derived figures are for information only and may be delayed, adjusted or revised by the exchange.
Not financial advice: Investify is not a brokerage and does not provide investment, trading or financial advice. Nothing on this page is a recommendation to buy or sell any security. Do your own research or consult a licensed advisor before making investment decisions. Read our data & editorial policy.