
Dividend Yield Calculator
THE STOCK
How much does it pay you to hold it?
Loading live data for OGDC. Example figures show until it arrives.
OGDC DIVIDEND YIELD
8.89%
High
Rs 24.00 a year on a Rs 270.00 share. After 15% tax: 7.56%.
Rs 7,556
a year on Rs 1 lakh, after tax
Rs 630
a month on Rs 1 lakh
A trailing yield, from dividends already paid. Edit the dividend to test the one you expect next.
YIELD ON YOUR COST
Already own it? Add what you paid
Your average cost. Leave at 0 to skip.
AGAINST A 12-MONTH T-BILL
The T-bill pays more, after tax
T-bill rate from the October 28, 2026 auction. A T-bill pays a fixed return if held to maturity; a dividend can be cut and the share price can fall, so the two are not like for like.
IS THE DIVIDEND SAFE?
Add earnings to check the cover
No EPS on file for this stock. Enter one to see the cover.
THE PRICE FOR YOUR YIELD
10% needs a price of Rs 240.00
-11.1% from today, with the same dividend.
-20%
11.1%
-10%
9.9%
Today
8.9%
+10%
8.1%
+20%
7.4%
The yield if the price moves and the dividend stays the same.
Next: see what these shares pay a month in the dividend calculator, or watch the dividends roll up in the DRIP calculator.
How dividend yield is calculated
Dividend yield tells you how much cash a share pays each year compared with what it costs today. It uses the annual dividend per share (every payout of the year added together) and the current share price. The calculator then adjusts it for dividend tax, for your own buy price, and checks it against earnings.
- DPS
- annual dividend per share, Rs
- EPS
- annual earnings per share, Rs
- Tax
- final withholding tax rate on the dividend
A worked example
A share trades at Rs 150.00, paid Rs 12.00 in dividends over the year and earned Rs 30.00 per share. You bought it at Rs 100.00. You are a filer, and the company is an ordinary listed one.
| Measure | Working | Result |
|---|---|---|
| Dividend yield | 12 ÷ 150 | 8% |
| After-tax yield | 8% × (1 − 15%) | 6.8% |
| Yield on cost | 12 ÷ 100 | 12% (10.2% after tax) |
| Payout ratio | 12 ÷ 30 | 40% |
| Dividend cover | 30 ÷ 12 | 2.5 times |
For comparison, a 12-month T-bill gave 12.89% at the October 28, 2026 auction, which is about 10.96% after a filer's tax. The T-bill return is fixed if held to maturity. The dividend can be raised or cut, and the share price can rise or fall, so the comparison is a reference point and not a verdict. The T-bill calculator works out the T-bill side in detail.
Trailing and forward yield
The yield on most screens is a trailing yield: it divides dividends already paid by today's price. It is a fact, but it looks backwards. A forward yield divides the dividend you expect over the next twelve months by the price. That is a forecast, and it is only as good as the forecast. Where a company has just announced a higher or lower payout, the forward figure can differ a lot from the trailing one. Edit the dividend per share in the calculator to try a forward case, and see the dividend discount model for valuing a stream of growing dividends.
When a high yield is a warning
Yield is a fraction, so it rises when the price falls. A share that drops sharply can show a high yield for exactly that reason, while the market is doubting that the dividend will continue. Before leaning on a high yield, look at four things:
- Payout ratio and cover. A payout above 100% (cover below 1) means the company paid out more than it earned in that period.
- One-off payments. A special dividend or a large final payout in one year inflates the trailing yield. Check the payout history on the company page.
- Business cycle. Dividends of oil and gas, fertilizer and cement companies move with commodity prices, gas supply and demand. Last year's payout is not a promise.
- Price trend. A falling price with an unchanged dividend raises the yield without any improvement in the business.
Yield is only part of the return
Yield counts the cash a share pays. Your total return also includes what happens to the price. A share bought at Rs 150.00 that pays Rs 12.00 and then trades at Rs 135.00 has returned -2% before tax, even though its yield was 8%: the 10% price fall is bigger than the dividend. In the other direction, a share with a low yield and a rising price can return more than a high yielder whose price drifts down. To measure what a stock actually returned over a period, with dividends added back, use the stock return calculator, and read the dividend versus growth stocks guide for how the two styles differ.
Why PSX yields look high
Dividend yields on the PSX have often been higher than those in many developed markets. Two facts help explain it. Many large PSX companies pay out most of what they earn, and interest rates in Pakistan are high: the State Bank policy rate is 12% from October 27, 2026, and inflation was 10.3% in September 2026. Investors can earn a high return on government paper, so a share has to offer more to compete. Read a PSX yield against those rates, not against yields in markets with near-zero interest rates. To see the effect of reinvesting dividends, try the DRIP calculator, and to plan income use the dividend income calculator.
Sources and assumptions
Tax rates and T-bill yields checked October 31, 2026.
- FBR Withholding Tax Rates Card, tax year 2027
- SBP, Market Treasury Bills auction results (latest)
- State Bank of Pakistan, Monetary Policy Statement (October 2026)
- Dividend and earnings per share: latest reported figures on Investify, with the period shown next to each number
Results are estimates for information and planning only, not tax, legal or investment advice. Check your own case with a tax adviser, your broker or the official source before acting.
FAQ
Dividend Yield Calculator: common questions
How do I calculate dividend yield?+
Divide the annual dividend per share by the share price and multiply by 100. A stock at Rs 150.00 that paid Rs 12.00 over the last year has a yield of 8%. Add up every payout of the year (interim and final) to get the annual dividend per share.
Is the dividend yield before or after tax?+
The yield you see on most websites is before tax. Companies deduct final tax when they pay. For tax year 2027 an ordinary listed company deducts 15% from filers and more from non-filers. A 8% yield is 6.8% after tax for a filer. This calculator shows both.
What is yield on cost?+
Yield on cost is the current annual dividend divided by the price you originally paid. If you bought at Rs 100.00 and the dividend is now Rs 12.00, your yield on cost is 12%, even though the market yield at Rs 150.00 is 8%. It measures what your own money earns, and rises when the dividend grows faster than you bought in.
What is a good dividend yield on the PSX?+
There is no single good number. A useful test is to compare the after-tax yield with a risk-free alternative: the 12-month T-bill cut-off was 12.89% at the October 28, 2026 auction, about 10.96% after the filer's tax. Then check that earnings cover the dividend and that the payout history is steady. A high yield on its own is not a reason to buy.
Why did the yield change when the dividend did not?+
Yield moves with the price. If the share falls 20% from Rs 150.00 to Rs 120.00, the same Rs 12.00 dividend becomes a 10% yield, which looks better but may mean the market expects trouble. If the price rises, the yield falls.
What is the difference between payout ratio and dividend cover?+
Both compare the dividend with earnings. The payout ratio is the dividend as a share of earnings per share (Rs 12.00 on Rs 30.00 is 40%). Dividend cover is the same idea upside down: earnings per share divided by the dividend, here 2.5 times. A cover below 1 means the company paid out more than it earned.
What is the difference between trailing and forward dividend yield?+
Trailing yield uses dividends already paid over the last twelve months. Forward yield uses the dividend you expect over the next twelve months, from guidance or your own estimate. Trailing is factual but looks backwards, forward is a forecast. The calculator uses the latest reported annual dividend and lets you edit it to test a forward figure.
Keep going
Related tools
Dividend Income Calculator
Dividend income from your PSX shares after withholding tax, per payout and per year.
Dividend Reinvestment (DRIP) Calculator
How reinvesting dividends and growing payouts compound a PSX holding over time.
Dividend Discount Model Calculator
Gordon growth and two-stage dividend models for dividend-paying PSX stocks.
PSX guides
Learn the ideas behind the numbers

Dividend Stocks vs Growth Stocks on PSX
A beginner-friendly PSX guide comparing dividend stocks and growth stocks, including risks, investor fit, sectors, interest rates and market cycles.
Read guide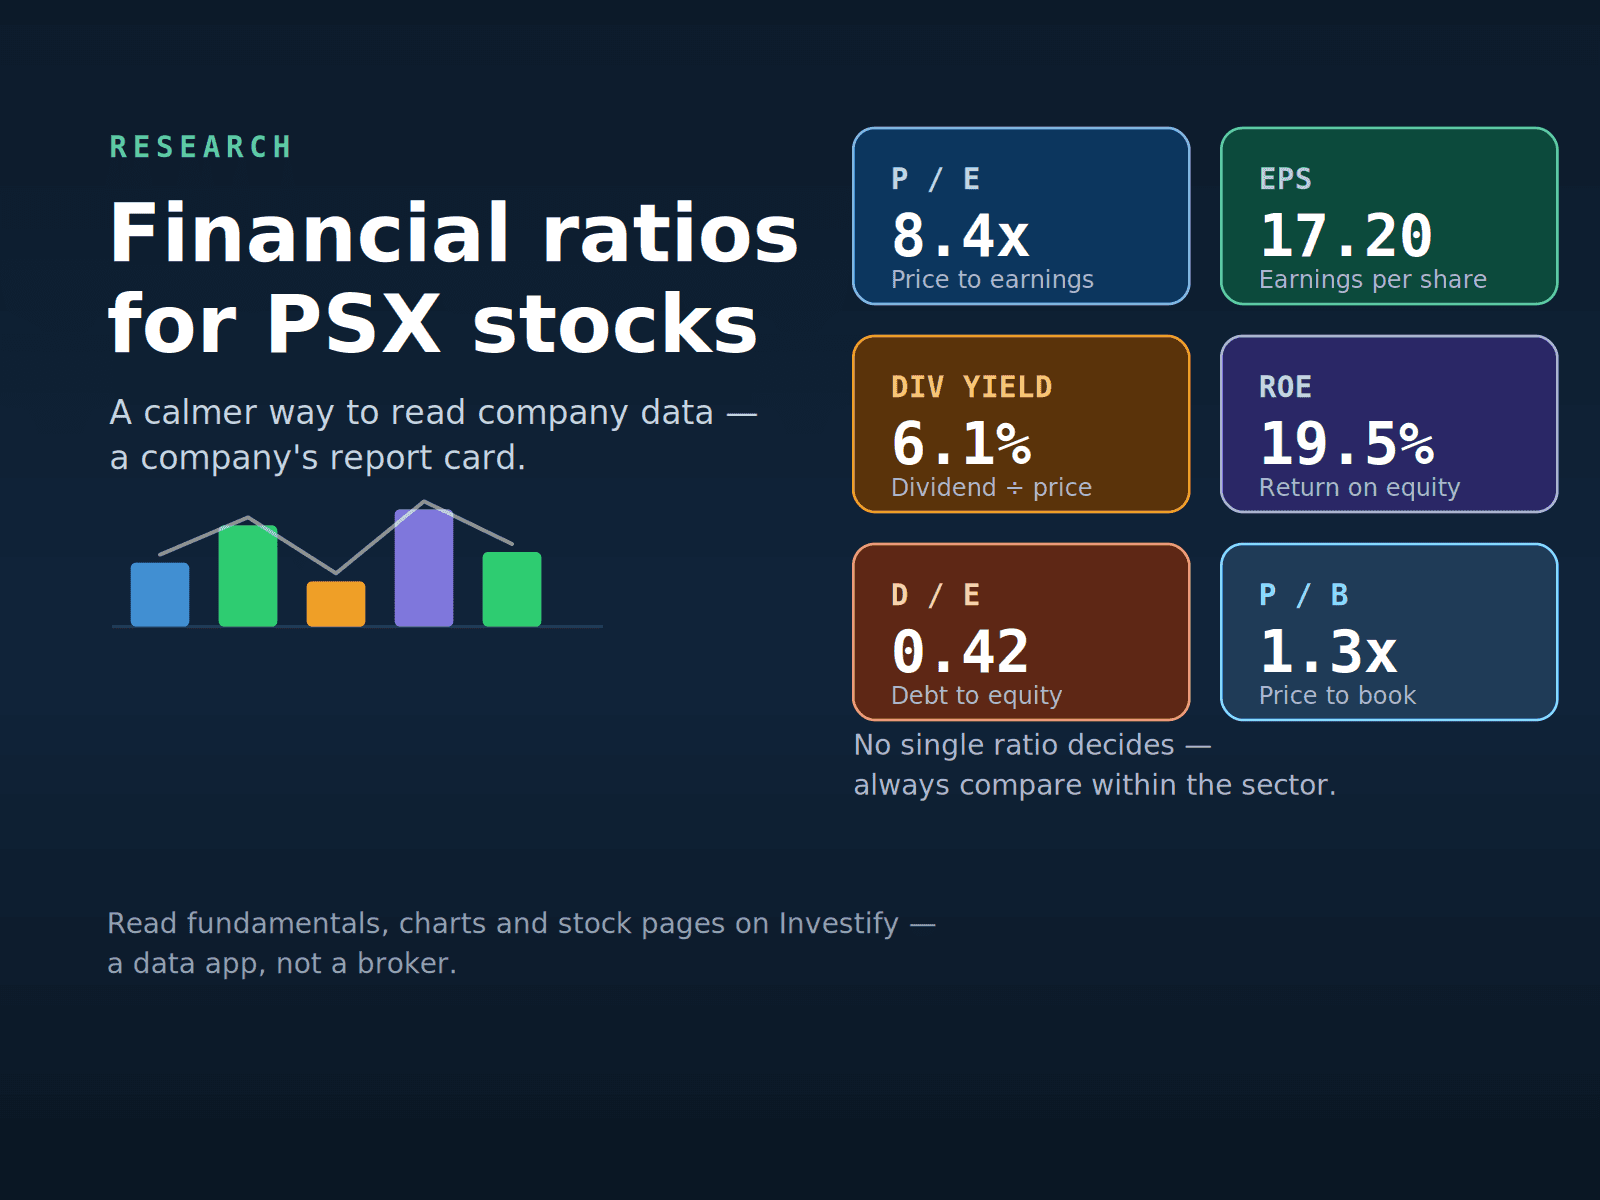
Beginner-Friendly Financial Ratios for PSX Stocks
A simple guide to key financial ratios for Pakistan Stock Exchange stocks, including EPS, P/E, dividend yield, book value, ROE, margins, debt ratios and how beginners should read them.
Read guide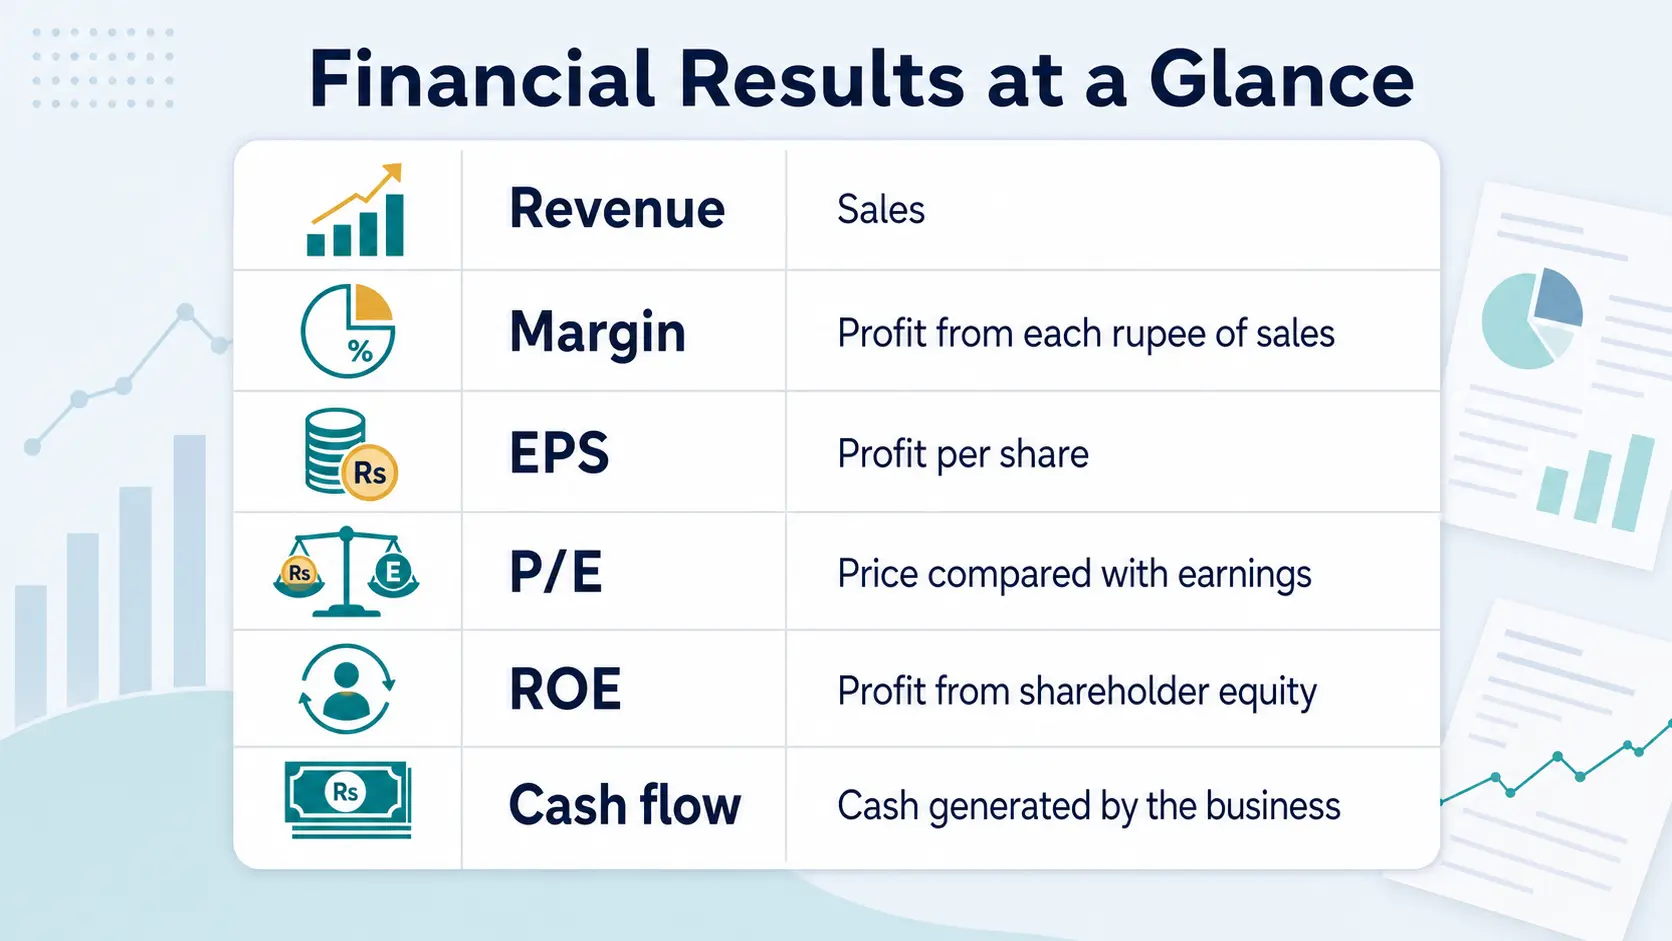
PSX Financial Results Explained: EPS, Revenue, Profit and Dividends
Learn how to read PSX financial results: revenue, margins, EPS, dividends and cash flow, so company earnings announcements finally make sense.
Read guide