
Intrinsic Value (DCF) Calculator
THE BUSINESS
What is the share really worth?
Loading the latest figure...
Loading the latest figure...
Default 20%: the 10-year PIB yield of 12.85% plus about 7 points.
OGDC FAIR VALUE
Loading the latest PSX figures for OGDC...
How the two-stage DCF works
A discounted cash flow (DCF) values a share as the present value of everything it will pay its owner. The calculator splits the future in two. In stage 1, earnings grow at your chosen rate for a set number of years. After that, in stage 2, growth settles to a modest steady rate forever, and the whole of that distant future is collapsed into one terminal value. Every amount is then discounted back to today at your required return.
Terminal value TV = EN × (1 + g_T) ÷ (r − g_T), where EN = E₀ × (1 + g)N
- E₀
- starting EPS (or free cash flow per share), the latest full year
- g
- stage 1 growth per year
- r
- discount rate, your required return (cost of equity)
- N
- length of stage 1 in years
- g_T
- terminal growth per year, which must be lower than r
The terminal value is the Gordon growth formula: a stream that starts at EN × (1 + g_T) and grows at g_T forever is worth that first payment divided by (r − g_T). The calculator discounts at the end of each year and treats the starting figure as year 0.
A worked example
Take a company earning Rs 40.00 per share, growing 12% a year for 10 years, then 5% forever, discounted at 20%. Stage 1 earnings add up to a present value of Rs 279.10. The terminal value is Rs 869.64 at the end of year 10, worth Rs 140.45 today. Intrinsic value is Rs 419.55 per share, and 33% of it comes from the terminal value.
| Case | Discount rate | Value per share |
|---|---|---|
| Lower required return | 18% | Rs 495.30 |
| Base case | 20% | Rs 419.55 |
| Higher required return | 22% | Rs 362.56 |
| No growth at all (0% and 0%) | 20% | Rs 200.00 |
Two points of discount rate move the answer by roughly 16% each way. The no-growth row is a useful floor: it is simply earnings divided by the discount rate (Rs 40.00 ÷ 20%). Anything above it is what you are paying for growth.
Choosing the discount rate and terminal growth in Pakistan
Your discount rate is the return you could expect elsewhere for similar risk, so it starts from the risk-free rate. The 10-year PIB cut-off yield was 12.85% at the State Bank's October 7, 2026 auction, and the policy rate is 12%. Adding an equity risk premium of roughly 6 to 8 points, a rule of thumb rather than a published statistic, gives about 19% to 21%, so the calculator starts at 20%. When yields fall, your required return should fall with them and values rise.
Terminal growth is the hardest input to defend, so keep it low. The default is 5%, the low end of the 5% to 7% medium-term inflation range the State Bank targets, which assumes earnings at best keep pace with prices in the very long run. It must stay below the discount rate, and it should never exceed the long-run growth of the economy. Both rates are nominal rupee rates, so use a consistent view of inflation in your growth estimate.
What this model misses
- Earnings are not cash. EPS ignores the money a company must reinvest in plant, working capital and debt repayment. Companies stuck with large receivables, such as some power producers, can report profit without receiving the cash. Use free cash flow where you can.
- One growth rate for the whole of stage 1. Real growth is lumpy and usually fades. A single rate smooths over cycles in oil prices, cement margins or fertiliser offtake, so start from normal, not peak, earnings.
- The terminal value dominates. A big share of the answer rests on one assumption about the far future. Always read the sensitivity table.
- One-off items in EPS. Revaluation gains, tax settlements or impairments distort the starting figure. Check the results announcement before trusting a jump.
- Policy and currency risk. Windfall levies, tariff changes, gas price decisions and rupee moves can change a sector's economics overnight. They sit inside your discount rate and growth guess, not in the formula.
- Share count changes. Bonus shares and rights issues change EPS per share. Make sure the starting EPS is on the same share count as the price you compare with.
Using the result well
Treat intrinsic value as a range, not a number: run a cautious, a middle and an optimistic case and see how often the market price sits below them. Then cross-check with simpler yardsticks: the Graham number, the P/E ratio calculator and, for steady payers, the dividend discount model. If several methods agree the stock is cheap, the case is stronger than any one of them alone. To see which of two peers looks cheaper before you start, put them side by side in the stock comparison. For a company's latest results and history, open its page, for example OGDC.
Sources and assumptions
Rates checked October 31, 2026: 10-year PIB cut-off yield 12.85% (State Bank auction, October 7, 2026) and policy rate 12% (from October 27, 2026).
- State Bank of Pakistan, PIB auction results (latest result when checked: 10-year cut-off yield 12.85%, auction held October 7, 2026)
- State Bank of Pakistan, monetary policy statement (policy rate 12%, from October 27, 2026)
- Aswath Damodaran, Investment Valuation (Wiley), chapters on discounted cash flow valuation
- M. J. Gordon and E. Shapiro (1956), Capital Equipment Analysis: The Required Rate of Profit, Management Science
- Earnings per share, growth and price: Investify PSX data, with the reporting period shown beside each number
Intrinsic value is the output of a model built on your assumptions. It is not a price target or a recommendation to buy or sell. Results are estimates for information and planning only, not tax, legal or investment advice. Check your own case with a tax adviser, your broker or the official source before acting.
FAQ
Intrinsic Value (DCF) Calculator: common questions
What is intrinsic value?+
Intrinsic value is what a business is worth based on the cash it can pay its owners in the future, discounted back to today at the return you demand. It is an estimate from assumptions you choose, not a fact, and it is different from the market price, which is what other investors are paying right now.
What discount rate should I use for a PSX stock?+
Think of it as your required return: the risk-free rate plus a premium for owning shares. The 10-year PIB cut-off yield was 12.85% at the State Bank's October 7, 2026 auction, and a premium of about 6 to 8 points on top is a common rule of thumb, which gives roughly 19% to 21%. This calculator starts at 20%. Raise it for riskier or more cyclical companies and lower it for steady, utility-like ones.
What growth rate should I enter?+
Use a rate you could defend for the whole of stage 1. The calculator starts from the growth implied by the company's latest results: the latest quarters scaled to a full year, compared with last year's EPS. That is a single period, so it swings with the season, and the calculator holds it between 0% and 25%, because very high growth rarely lasts for years and a one-off jump in profit says little about the future. If last year included an unusual gain or loss, start from a normal level of earnings instead. With the annualised EPS estimate as the starting figure, the jump is already in year 0, so growth starts from an assumed rate rather than the implied one.
Should I use EPS or free cash flow per share?+
Free cash flow is the stricter measure because it deducts the money a company must spend to keep or grow its business. EPS is easier to find and fits companies that reinvest little, such as banks or high-payout fertiliser and power companies. We do not carry cash flow statements, so the free cash flow option asks you to type the figure from the annual report.
Why is so much of the value in the terminal value?+
A business is assumed to keep earning after the explicit years, and those later years are added up in a single terminal value. With a high discount rate the years closest to today carry more weight, but terminal value is still often half or more of the total. That is why the sensitivity table matters: a small change in the discount rate or terminal growth moves the answer a lot.
What is a margin of safety?+
It is the gap you require between the price you pay and your estimate of intrinsic value, as protection against errors in the estimate. With a 25% margin of safety you would only buy at 75% of intrinsic value or less. The buy-below price in the results is intrinsic value multiplied by one minus your margin.
Can I use a DCF for a bank or an insurance company?+
Not on free cash flow: a bank's loans and deposits are its operations, so cash flow is not meaningful. Use EPS or, better, the dividend discount model, and compare with price to book. For this reason the free cash flow option is best kept for industrial and consumer companies.
Why does the calculator say the value is not available?+
A DCF needs a positive starting figure, so it cannot value a company that lost money in the base year. It also needs the discount rate to be higher than the terminal growth rate, otherwise the terminal value would be infinite. Change the starting EPS or one of the rates and the result returns.
Keep going
Related tools
Graham Number Calculator
Benjamin Graham's fair value from EPS and book value, for any PSX stock.
P/E Ratio & Fair Price Calculator
P/E, earnings yield, PEG and the price a target P/E implies.
Dividend Discount Model Calculator
Gordon growth and two-stage dividend models for dividend-paying PSX stocks.
PSX guides
Learn the ideas behind the numbers

How to Research PSX Companies Before Buying Shares
A practical PSX company research checklist for beginners: read stock pages, fundamentals, charts, technicals, announcements, annual reports and market news before buying.
Read guide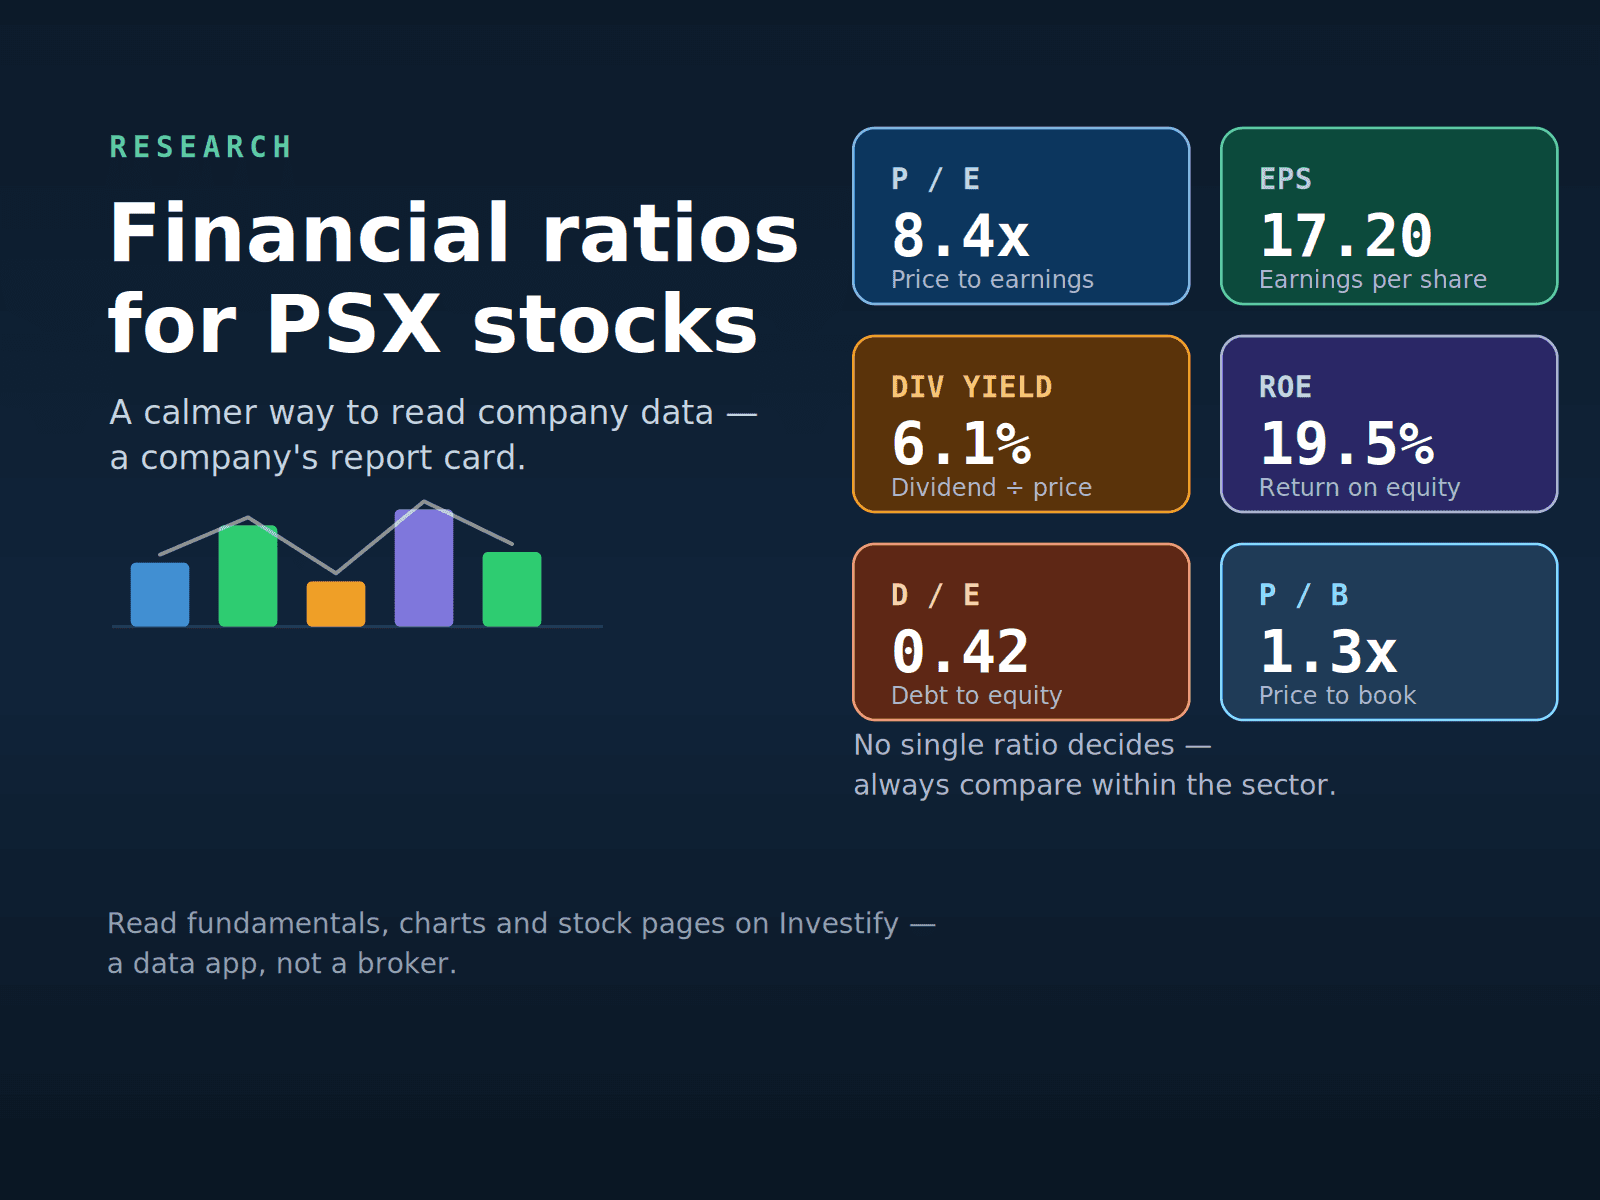
Beginner-Friendly Financial Ratios for PSX Stocks
A simple guide to key financial ratios for Pakistan Stock Exchange stocks, including EPS, P/E, dividend yield, book value, ROE, margins, debt ratios and how beginners should read them.
Read guide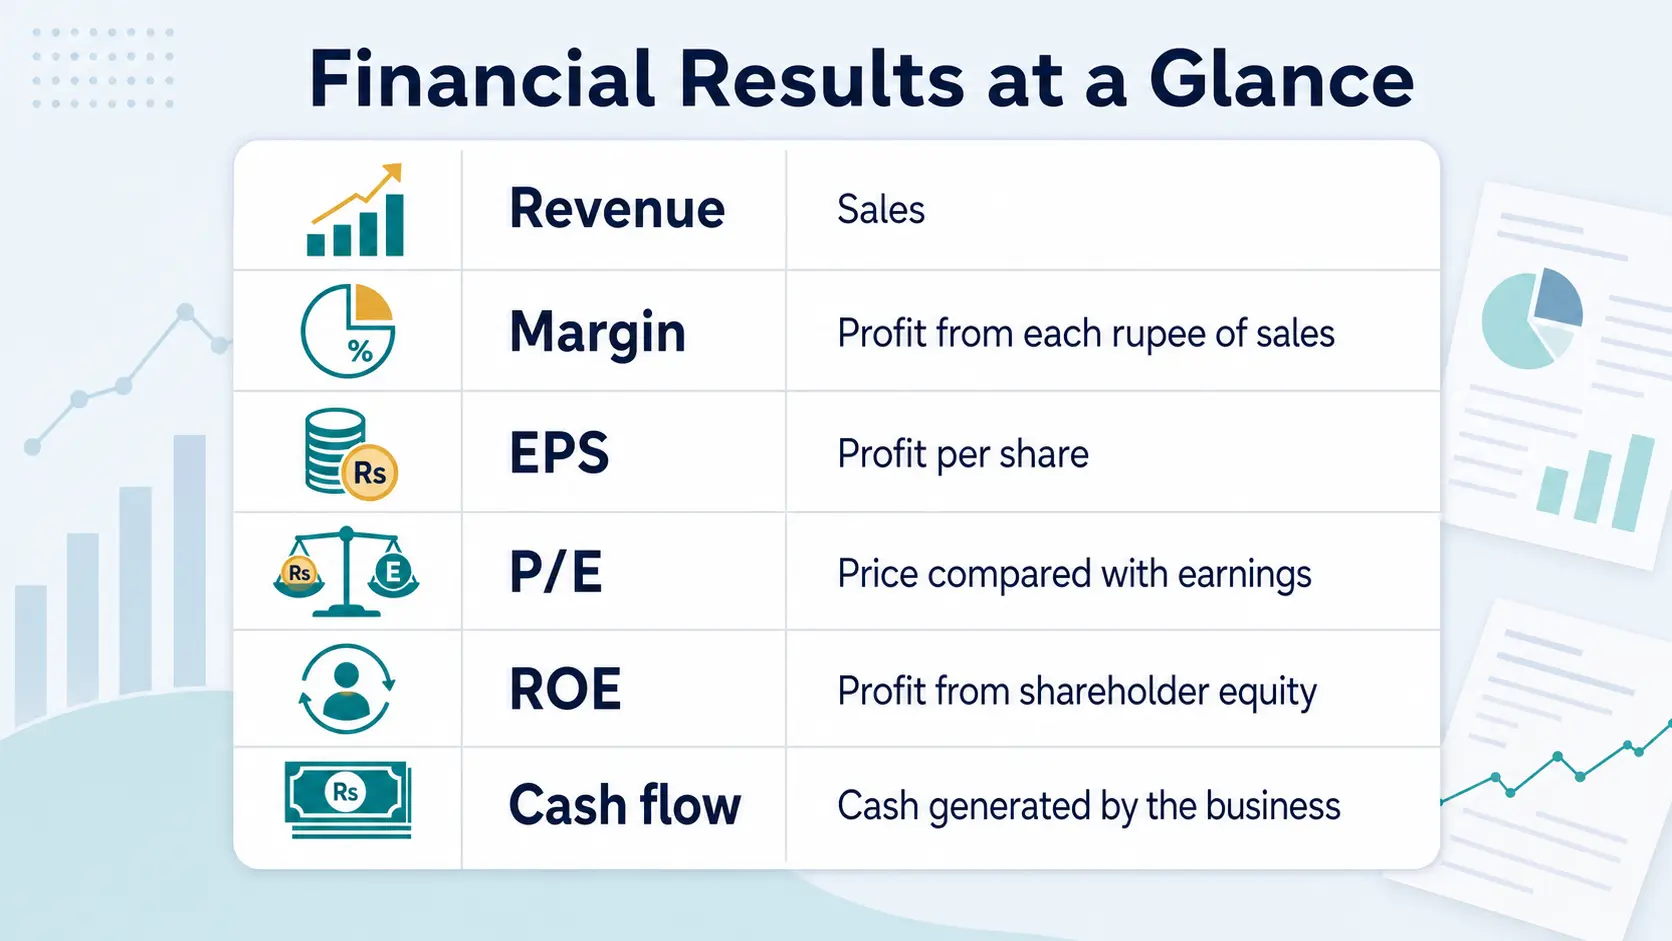
PSX Financial Results Explained: EPS, Revenue, Profit and Dividends
Learn how to read PSX financial results: revenue, margins, EPS, dividends and cash flow, so company earnings announcements finally make sense.
Read guide