
PSX Stock Return Calculator
THE TIME MACHINE
If you had invested back then
Price history starts in November 2021. A non-trading day moves to the next session.
Results
Loading OGDC price history...
How the stock return calculator works
The calculator reads Investify's daily closing prices for the stock, finds the first trading session on or after the date you chose, and buys at that day's close. For a one-time investment it buys once. For a monthly plan it buys the same amount on the first trading day of every following month. Every day until your end date, the holding is valued at that day's close, which is what the chart shows.
- Shares
- amount ÷ buying price (fractions allowed; the advanced view also shows whole shares only)
- Total return
- value now ÷ money invested − 1
- CAGR
- (value now ÷ money invested)^(1 ÷ years) − 1, shown from about one year of data
- XIRR
- the yearly rate that makes every monthly payment grow to today's value (used for monthly plans)
Risk figures come from the same prices. The biggest fall from a peak (maximum drawdown) is the largest drop from a high close to a later low close inside your period; the best and worst month are the calendar months with the highest and lowest price change, counting only complete months. They show how bumpy the ride was, not only where it ended.
Worked examples
The prices below are made up to show the arithmetic. Putting Rs 100,000 into a stock at Rs 80.00 on January 3, 2022 buys 1,250 shares. If the price is Rs 200.00 on January 2, 2025, they are worth Rs 250,000: a total return of +150%, or about 35.7% a year over three years.
A monthly plan of Rs 10,000 over six months, with the price moving as in the table, buys 587.3 shares for Rs 60,000 and, at a final price of Rs 130.00, is worth Rs 76,346 (+27.2%). Your average cost is Rs 102.17, below the simple average price of Rs 105.00, because the dip in month two bought more shares. That is rupee cost averaging.
| Month | Price | Shares bought | Total shares |
|---|---|---|---|
| 02/01/2023 | Rs 100.00 | 100.00 | 100.00 |
| 02/02/2023 | Rs 80.00 | 125.00 | 225.00 |
| 02/03/2023 | Rs 90.00 | 111.11 | 336.11 |
| 02/04/2023 | Rs 110.00 | 90.91 | 427.02 |
| 02/05/2023 | Rs 120.00 | 83.33 | 510.35 |
| 02/06/2023 | Rs 130.00 | 76.92 | 587.28 |
Compare the two styles on your own stock with the SIP calculator for forward projections, and turn a total return into a yearly rate with the CAGR calculator. If you bought in several lots on different dates, the XIRR calculator gives your real yearly rate.
Price return and dividends
A price return counts only the change in the share price. Many PSX companies, especially in oil and gas, banking and fertiliser, pay a large share of their profit out as cash dividends, so an investor who held them received more than the price change. Our daily history does not carry dividend payments, so the calculator leaves them out by default and says so on the result.
If you want a rough idea of what dividends would have added, open More options and turn on the dividend estimate. It takes the stock's latest annual dividend per share as a yield on today's price, assumes the same yield every year and reinvests it. Real payouts rose, fell and sometimes stopped, so use the estimate as a guide, and check the actual dividend history on the stock's company page (replace OGDC with your symbol). Dividends are taxed at source: see the dividend tax calculator and the dividend income calculator.
What this tool cannot tell you
- It starts in November 2021. That is where our daily history begins, so five-year-plus questions need another source. For the index over longer periods, see the KSE-100 return calculator.
- Hindsight flatters. It is easy to pick today's winners and a lucky start date. Try several start dates and the monthly plan, which depends less on one day.
- Real trading costs are bigger than a percentage. Brokerage, CDC and exchange fees, sales tax on commission and capital gains tax all apply. Estimate them with the brokerage calculator.
- Buying at the close is an assumption. In practice you buy at a price during the day, and thinly traded stocks can move against you when you buy or sell.
To compare several stocks side by side, use compare PSX stocks; to see how much of a gain disappears to rising prices, try the inflation calculator.
Sources and assumptions
Method and data window reviewed October 31, 2026.
- Daily closing prices from Pakistan Stock Exchange market data via Investify, from November 2021, adjusted for bonus issues and splits
- KSE-100 index history from the same feed (a price index: no dividends, no costs)
- Inflation line: Pakistan CPI, Pakistan Bureau of Statistics (monthly from January 2024) and World Bank (yearly averages before that), see the inflation calculator
Results are estimates for information and planning only, not tax, legal or investment advice. Check your own case with a tax adviser, your broker or the official source before acting.
FAQ
PSX Stock Return Calculator: common questions
How do I calculate the return on a PSX stock?+
Divide what your shares are worth now by what you paid, then subtract one. If you put in Rs 100,000 and the holding is worth Rs 250,000, the total return is 150%. This calculator does it from real daily closing prices: pick the stock, the date you invested and an end date, and it works out the share count, today's value, the annualised return (CAGR) and how deep the worst fall was.
Does the calculator include dividends?+
No, by default it shows the price return only. Our price history is adjusted for bonus shares and splits but cash dividends are not added back, so a high-dividend stock will have paid you more than the figure shown. Under More options you can switch on an estimate that reinvests a constant yearly dividend yield (prefilled from the latest annual dividend per share), and it is labelled as an estimate because real payouts varied from year to year.
How far back does the price history go?+
November 2021 is the first session in our daily price history, about five years of trading. If you choose an earlier date, the calculation starts on the first available session. A stock that listed later starts from its first session in our data, and the calculator tells you when that is.
Why is the annualised return blank for a short period?+
CAGR turns a total return into a yearly rate. Over a few weeks or months that conversion is misleading (a 10% gain in one month is not a 214% yearly return you can count on), so the calculator only shows an annualised figure once the period is about a year or longer. Shorter periods show the total return.
What is the difference between a one-time and a monthly investment?+
A one-time investment buys everything on the start date. A monthly plan (a historical SIP) buys the same rupee amount at the close of the first trading day of every month, so you buy more shares when the price is low and fewer when it is high. Its annualised return is shown as XIRR, which weighs each monthly payment by how long it was invested.
Is the result before or after brokerage and tax?+
By default costs are ignored so the numbers are clean price moves. Under More options you can add a trading cost to every buy (0.18% by default, the all-in cost of a PSX trade on a Rs 100,000 ticket) and optionally the same cost when selling. Capital gains tax is not deducted; use the capital gains tax calculator for your own position. If you switch on the estimated dividends, they are counted net of dividend withholding tax: 15% for a filer and 30% for a non-filer on an ordinary listed company, or a rate you set yourself.
Why compare the result with the KSE-100?+
A gain only means something against alternatives. The KSE-100 is the benchmark index of the largest PSX companies, so the same money invested in it on the same dates shows whether your stock did better or worse than simply following the market. The index is a price index without costs or dividends, so when your stock figure includes brokerage or estimated dividends (More options) the comparison says so.
Can past returns predict future returns?+
No. A stock that rose a lot may have done so because of a one-off event, and the figures here depend on the exact start and end dates you pick. Use them to understand how big the ups and downs have been (the maximum fall and the best and worst months) and not as a forecast.
Keep going
Related tools
KSE-100 Return Calculator
KSE-100 index returns between any two dates, annualised and against inflation.
CAGR Calculator
Compound annual growth rate between two values, and the value a target CAGR gives.
Compare PSX Stocks
Two to four PSX stocks side by side: price, returns, valuation, dividends and profitability.
Inflation Calculator Pakistan
What rupees from any year are worth today, from Pakistan's CPI history.
PSX guides
Learn the ideas behind the numbers

Dividend Stocks vs Growth Stocks on PSX
A beginner-friendly PSX guide comparing dividend stocks and growth stocks, including risks, investor fit, sectors, interest rates and market cycles.
Read guide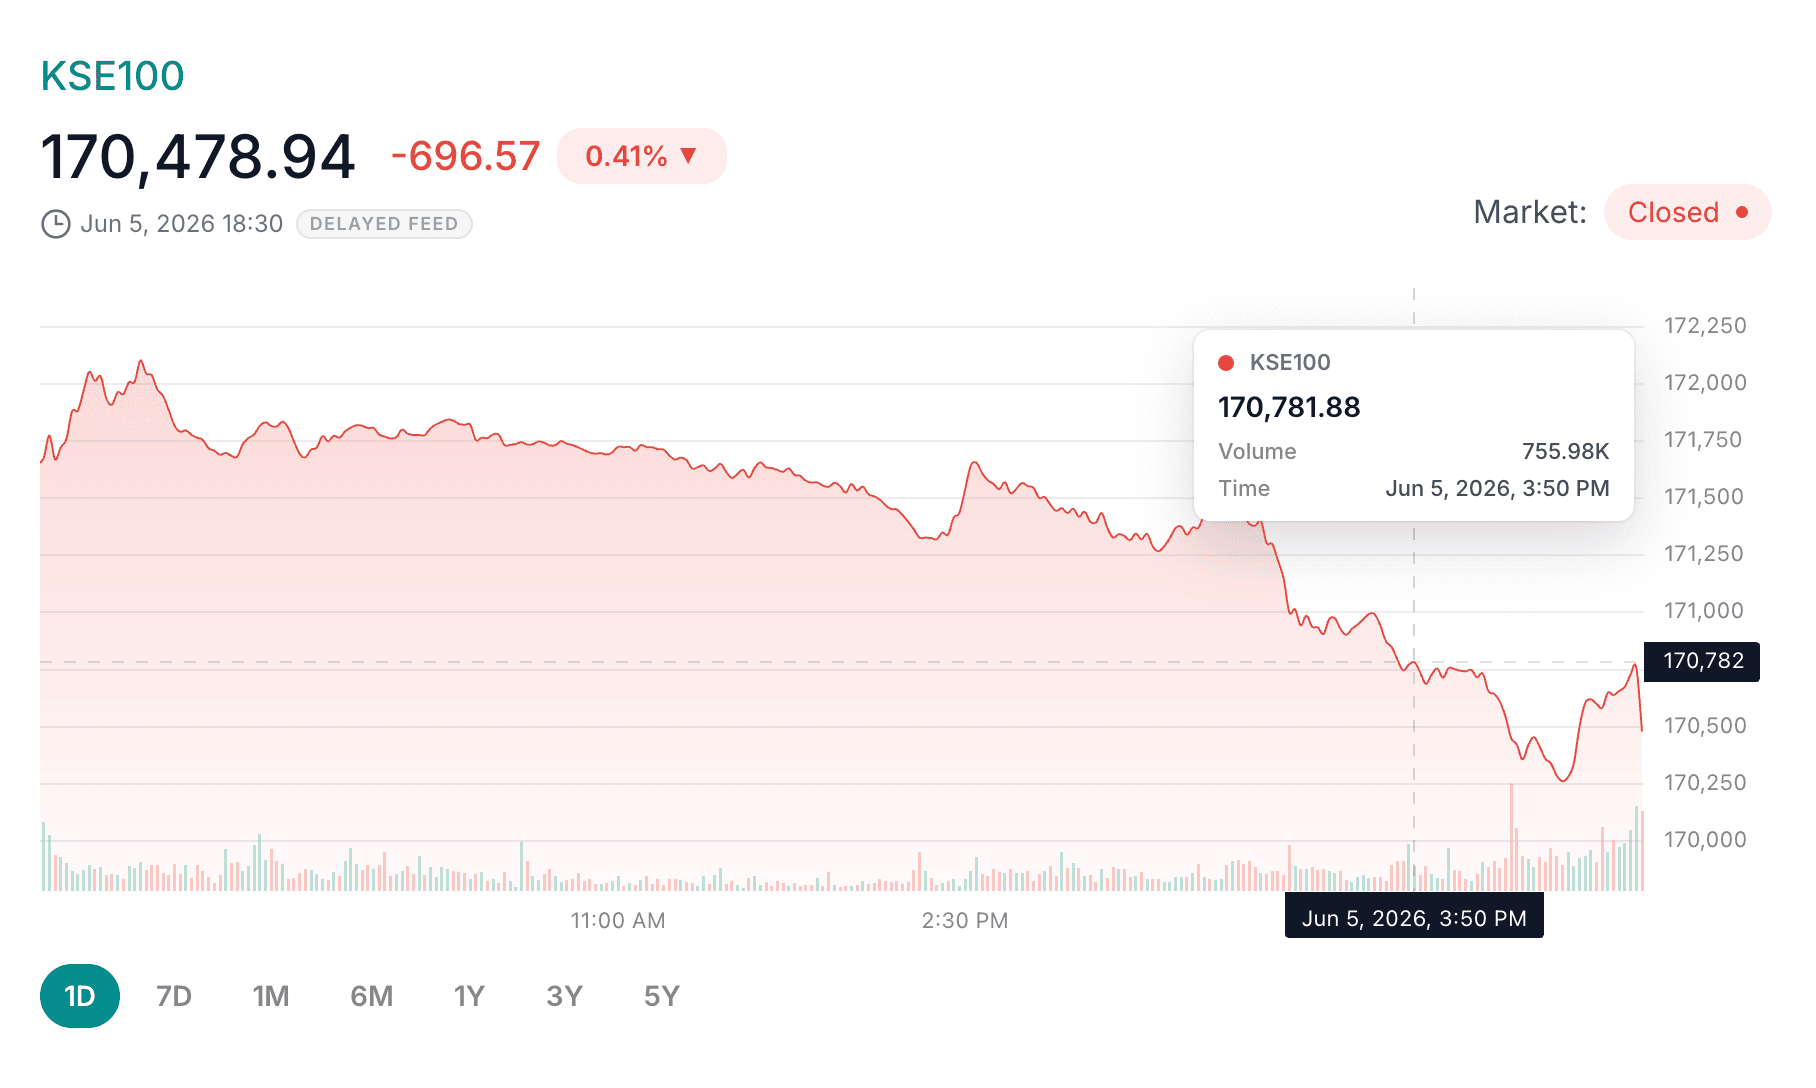
How to Read Stock Charts and Market Trends on PSX
Learn how to read PSX stock charts, price trends, volume bars, timeframes, day range and technical indicators without treating charts as guaranteed predictions.
Read guide
How to Research PSX Companies Before Buying Shares
A practical PSX company research checklist for beginners: read stock pages, fundamentals, charts, technicals, announcements, annual reports and market news before buying.
Read guide