
Stock Average Price Calculator
YOUR BUYS
Every time you bought, in order
Buy 1Rs 64,020 paid
Buy 2Rs 38,800 paid
Market price is not available, so this is an example. Enter your own price.
Waiting for a market price for HUBC. Until it arrives, or if the symbol is not listed, the numbers below use an example price. Type your own price to override it.
YOUR AVERAGE IN HUBC
Rs 205.64a share
500 shares, Rs 102,820 paid
Down Rs 5,820 (-5.7%) at Rs 194.00
HUBC needs to rise 6% to Rs 205.64 for you to break even.
THE NEXT STEP
Bring your average down
Pick a buy price and the average you want. A buy pulls your average toward its own price, never past it.
Market price is not available, so this is an example. Enter your own price.
Buy
500 more shares
at Rs 194.00, Rs 97,000 in all, and your average becomes Rs 199.82.
The Rs 5,820 you are down stays the same. Averaging down shortens the climb back but puts Rs 97,000 more into HUBC. Buy only if you would buy it fresh at Rs 194.00.
OR BUY A ROUND AMOUNT
If you buy more at Rs 194.00
25% more
125 shares
Rs 24,250
New average
Rs 203.31
-1.1%
50% more
250 shares
Rs 48,500
New average
Rs 201.76
-1.9%
Double up
500 shares
Rs 97,000
New average
Rs 199.82
-2.8%
Triple up
1,000 shares
Rs 194,000
New average
Rs 197.88
-3.8%
How your average moved
| # | Type | Shares | Price | Held after | Average after |
|---|---|---|---|---|---|
| 1 | Buy | 300 | Rs 213.40 | 300 | Rs 213.40 |
| 2 | Buy | 200 | Rs 194.00 | 500 | Rs 205.64 |
How the average price is worked out
Your average cost is a weighted mean: every purchase counts in proportion to how many shares it bought. Cheap buys pull the average down only as far as they are large. Ten shares at Rs 50 barely dent a holding of 1,000 shares at Rs 100.
- Qᵢ, Pᵢ
- shares and price of purchase i
- Average
- your cost per share across all purchases
Your break-even is the price at which selling returns exactly what you spent, including the fees of the buy and the sell. With each leg costing a fraction c of its value, break-even is average × (1 + c) ÷ (1 − c). At the default 0.37% round trip, c is 0.185%, so break-even sits about 0.37% above your average.
A worked example
You buy 300 shares at Rs 120, then 200 shares at Rs 95. You have paid Rs 55,000 for 500 shares, an average of Rs 110.00. If the stock trades at Rs 100 you are down Rs 5,000 (9.1%), and with 0.37% round-trip costs you need about Rs 110.41 just to get out even.
Say you want your average at Rs 105 and can buy at Rs 95. The planner solves it: buy 250 more shares (Rs 23,750), taking you to 750 shares at exactly Rs 105.00. Buying only as many shares as you already hold (500 at Rs 95) would give Rs 102.50.
| Step | Shares held | Total cost | Average cost |
|---|---|---|---|
| Buy 300 at Rs 120 | 300 | Rs 36,000 | Rs 120.00 |
| Buy 200 at Rs 95 | 500 | Rs 55,000 | Rs 110.00 |
| Buy 250 more at Rs 95 | 750 | Rs 78,750 | Rs 105.00 |
Averaging down: when it helps and when it hurts
Averaging down means buying more of a stock after it has fallen to lower your average cost. The arithmetic always works, but the arithmetic is not the question. The question is whether you would buy the stock today if you did not own it. If yes, adding at a lower price is a sound way to build a position in steps. If the reason you bought has changed, or the price is falling because the business is getting worse, buying more raises the amount you can lose.
- Decide the plan before the fall. Set how many buys you will make and the total you will put in, then use the position size calculator so the whole position stays within the risk you chose.
- Do not average into a stock you cannot explain. Read the latest results and announcements first, using the guide on researching PSX companies.
- Watch the cost of many small buys. Every buy and sell pays commission and fees. Check the full cost with the brokerage calculator.
- Averaging up is the same sum. If a stock you own has risen and you add more, your average rises too. The planner handles both directions.
FIFO, average cost and tax on your sales
When you sell part of a holding bought at different prices, which shares did you sell? FIFO (first in, first out) says the oldest. Average cost says a slice of every share at the running average. The same trade gives different booked gains: with 100 shares at Rs 100 and 100 at Rs 200, selling 100 at Rs 250 books +Rs 15,000 under FIFO and +Rs 10,000 under average cost, and leaves a remaining average of Rs 200.00 or Rs 150.00.
For tax, PSX capital gains tax rates depend on when each share was acquired and how long it was held, so every sale has to be matched to particular purchases. We could not confirm from a primary source whether NCCPL, which computes and collects the tax, matches sales first-in-first-out or on average cost, so this calculator does not claim either as the tax answer. Check the capital gains statement from NCCPL or your broker, and use the capital gains tax calculator for the rates. The Investify portfolio itself sells oldest shares first (FIFO), the same as the mobile apps.
Planning your buys before the price moves
The planner is most useful before you need it. Decide in advance the price levels at which you would add and how much you would add at each, then check what each step does to your average and to your break-even. Two small extra buys at lower prices move the average far less than one large one, and a plan that needs a very large buy to make a small difference to the average is a sign to leave the position alone.
Remember the daily limits too: a PSX stock can move 10% either way in a day (Re. 1 for stocks under Rs 10), so a planned buy at a much lower price may take several sessions to arrive, or may never. Check what is possible today with the upper and lower lock calculator.
Sources and assumptions
Lot size, tick size and trading-cost assumptions checked October 31, 2026.
- PSX notice N-327 (April 15, 2024): one-share lot on the regular market
- PSX data portal, quotes and previous close
- NCCPL, capital gains tax rates for tax year 2027
- Income Tax Ordinance, 2001, section 37A (capital gain on securities)
- Calculation: weighted average cost = total cost ÷ total shares; break-even = average × (1 + c) ÷ (1 − c) with c half the round-trip cost
The average and break-even use the prices and costs you enter. Capital gains tax is not included. Results are estimates for information and planning only, not tax, legal or investment advice. Check your own case with a tax adviser, your broker or the official source before acting.
FAQ
Stock Average Price Calculator: common questions
How do I calculate the average price of shares I bought at different prices?+
Add up what you paid for every purchase (shares times price) and divide by the total number of shares. If you bought 300 shares at Rs 120 and 200 shares at Rs 95, you paid Rs 55,000 for 500 shares, so your average cost is Rs 110. The calculator does this for up to six rows and updates as you type; with more buys, merge the oldest into one row at their average price.
Does averaging down reduce my loss?+
No. It lowers the price the stock has to recover to before you break even, but the loss you already hold stays the same and you now have more money exposed to the same stock. If the price keeps falling, a bigger position loses more. Average down only when you would be happy to buy the stock fresh at today's price.
How many shares do I need to buy to bring my average down to a target price?+
Use shares to buy = current shares × (target − current average) ÷ (buy price − target). With 500 shares at an average of Rs 110, a target of Rs 105 and a buy price of Rs 95, that is 500 × (−5) ÷ (−10) = 250 shares. The planner on this page does the sum and rounds up to a whole share.
Why does the planner say my target is not reachable?+
A new purchase can only pull your average toward its own price, never past it. If you hold at Rs 110 and buy at Rs 95, the best any amount of buying can do is get you closer and closer to Rs 95. A target of Rs 90 or Rs 95 is therefore impossible with buys at Rs 95, and so is a target above Rs 110.
Does the average price include broker commission and taxes?+
The headline average here is the pure price you paid. Under More options you can count a round-trip trading cost (0.37% by default), which moves your break-even price and your profit or loss. Some broker apps fold commission into the average and some do not, so the number on a broker statement can differ slightly from a price-only average. For exact fees use the brokerage calculator.
What is the minimum number of shares I can buy on PSX?+
One share. PSX moved its regular market to a one-share lot in 2024, so you can buy any quantity in stocks that used to trade in lots of 20, 50, 100 or 500. ETFs, deliverable futures and IPO bookings keep their 500-share lot.
Should I use FIFO or average cost when I sell some shares?+
FIFO assumes the oldest shares are sold first; average cost assumes every share was bought at the running average. They give different booked gains when you bought at different prices, but the total profit across booked and unbooked shares is the same. For tax, what matters is how NCCPL and your broker match the sale, so check your capital gains statement rather than relying on either method here.
Keep going
Related tools
PSX Brokerage & Trading Profit Calculator
Every fee on a PSX trade (commission, sales tax, CDC, NCCPL, SECP) and your net profit and break-even.
Position Size Calculator
How many shares to buy so a stop-loss costs you only the risk you chose.
Capital Gains Tax Calculator for PSX Shares
CGT on listed shares and mutual funds for filers and non-filers, by purchase date and holding period.
PSX guides
Learn the ideas behind the numbers
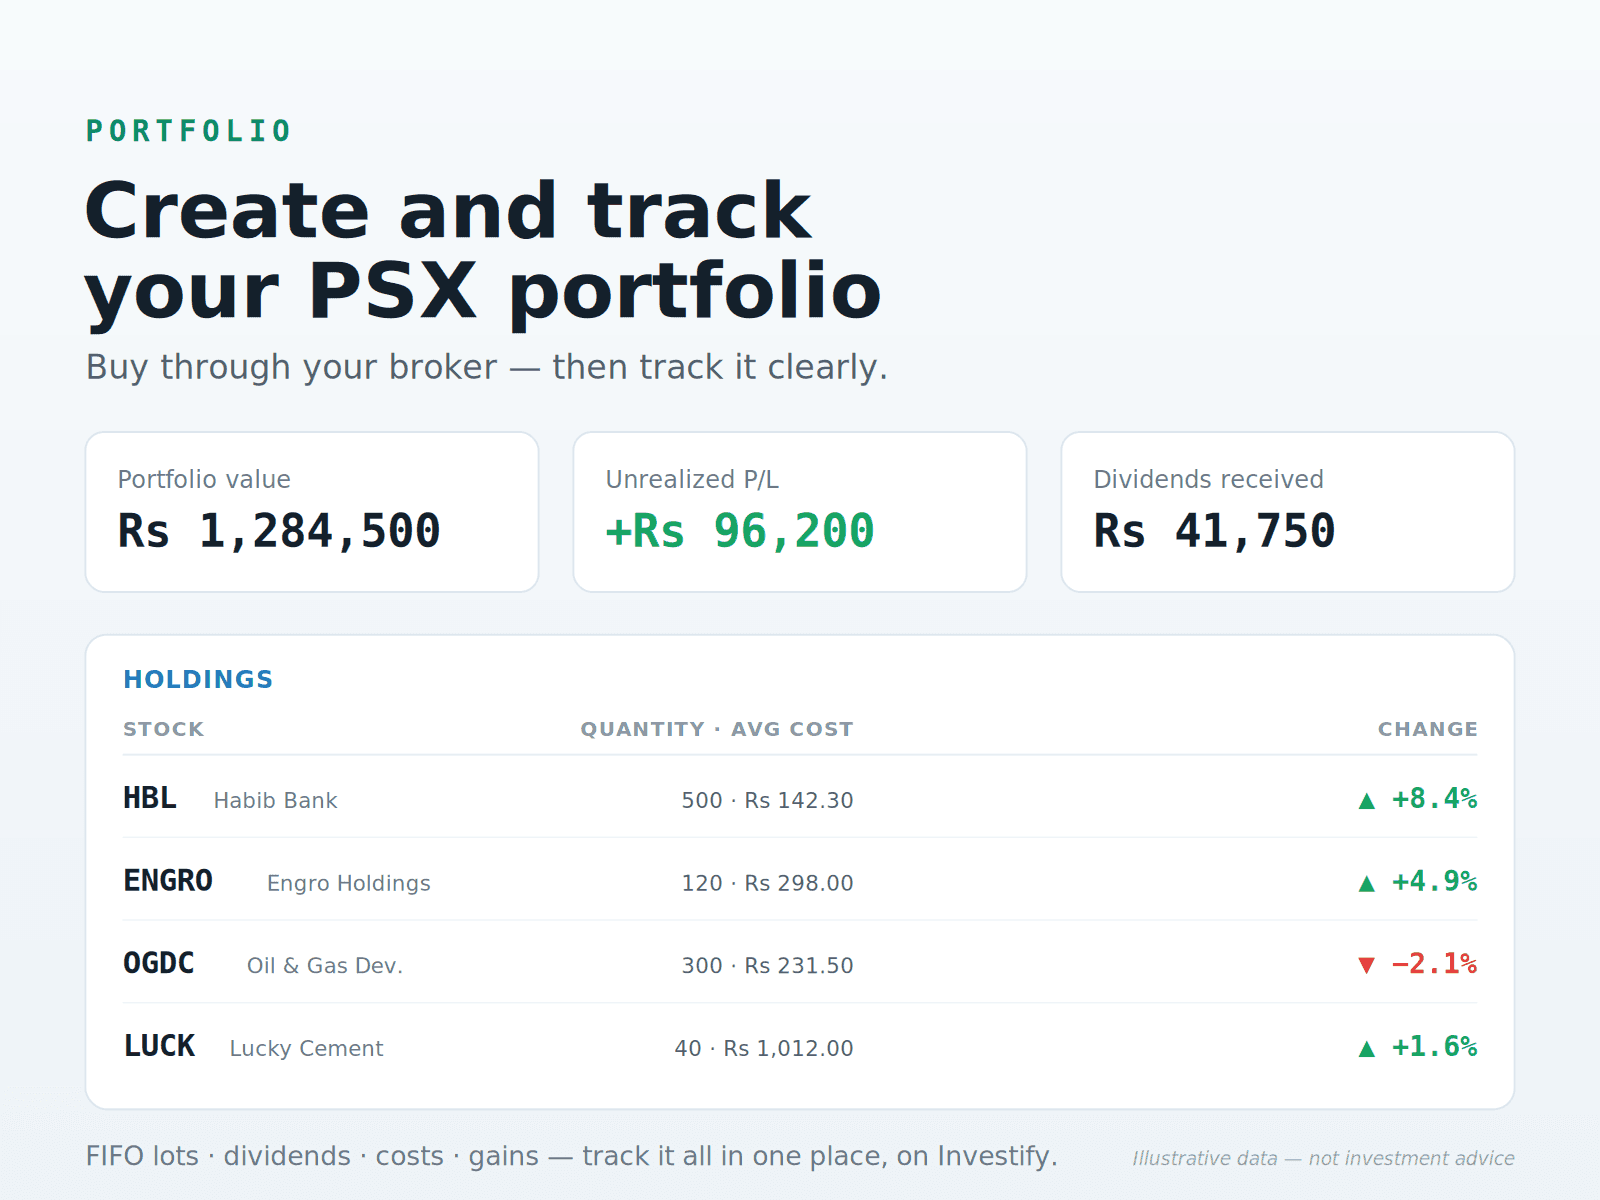
How to Create and Track a PSX Stock Portfolio
Learn how to create a PSX stock portfolio through a licensed broker and track it with FIFO, dividends, costs and corporate actions.
Read guide
Common Mistakes Beginners Make in the Pakistan Stock Exchange
A practical guide to common PSX beginner mistakes, including chasing tips, overtrading, ignoring risk, skipping research and not tracking portfolio decisions.
Read guide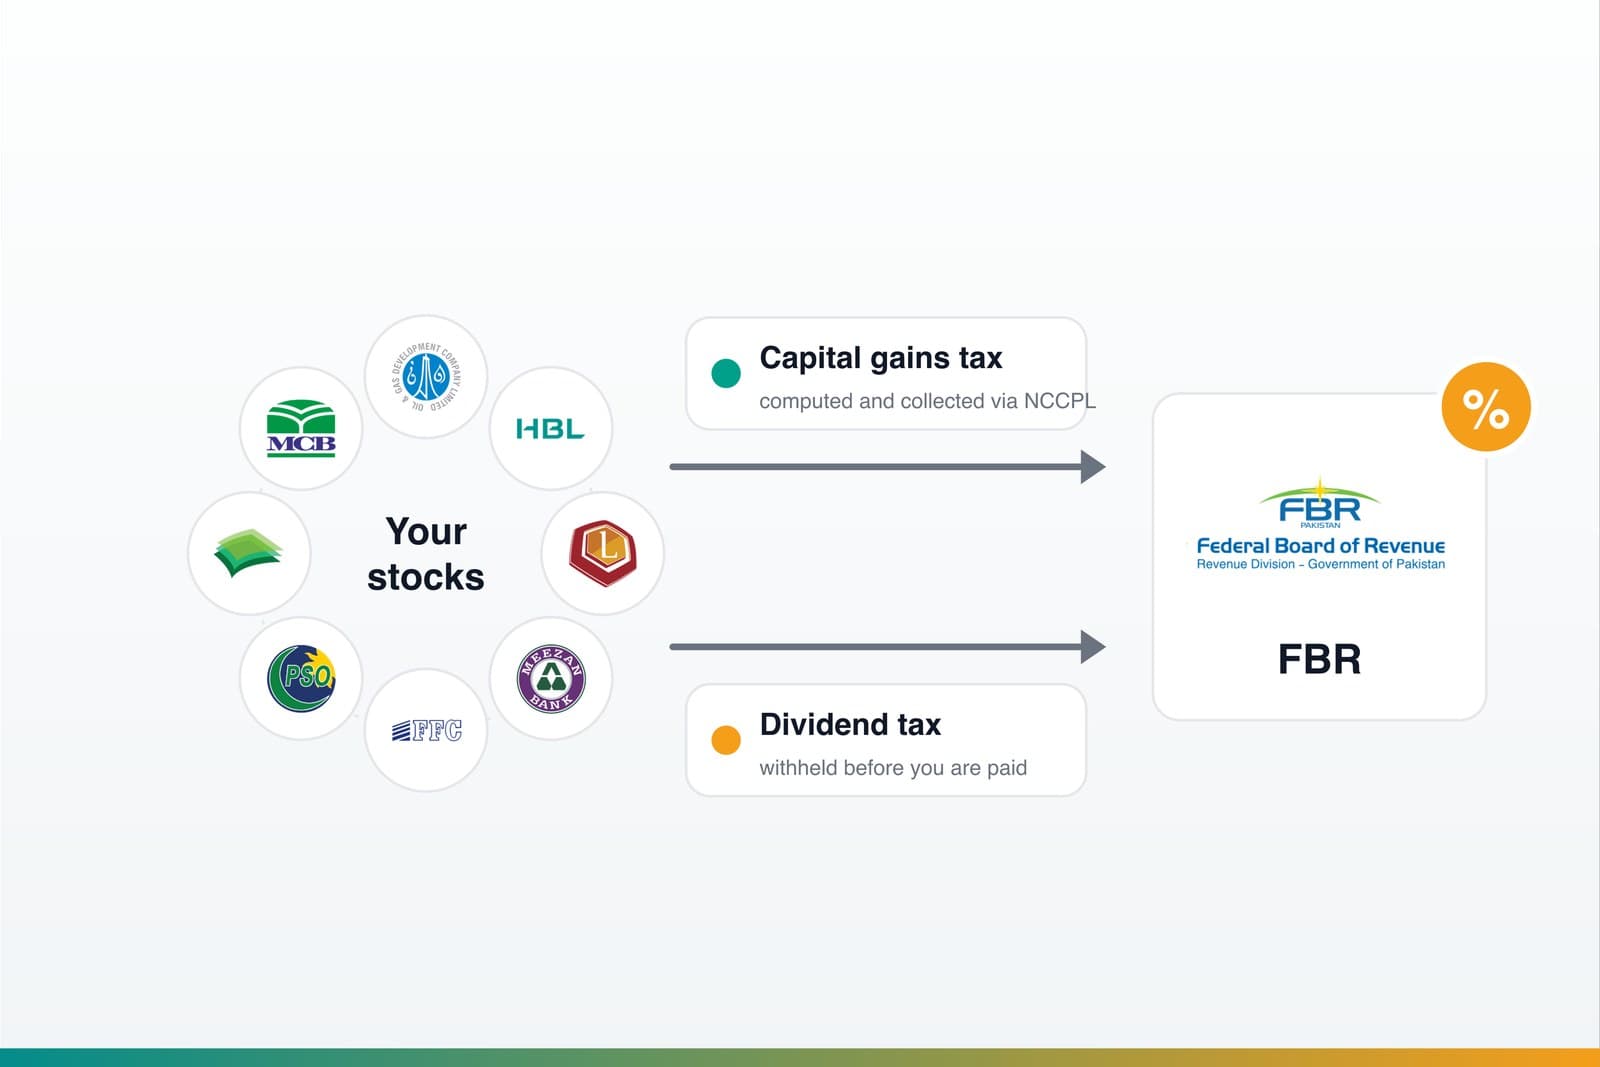
Capital Gains Tax & Dividend Tax on PSX Stocks (Pakistan)
A plain-English guide to how capital gains tax (CGT) and dividend tax work on Pakistan Stock Exchange shares - filer vs non-filer rates, how holding period and acquisition date matter, how NCCPL collects CGT, and what you still have to declare.
Read guide