

Ask a Pakistani family where to keep spare money and the answers have not changed in decades: gold, a savings certificate, a plot, or, more recently, the stock market. Each has a loyal camp and each has had a very good year. What is rarer is a side-by-side check of what really happened over a full ten years, with the dates, sources and arithmetic written down so you can redo it yourself.
This article compares four things from the start of 2016 to the end of 2025: the price of gold per tola, the KSE-100 index, a National Savings certificate as a savings proxy, and consumer price inflation from the Pakistan Bureau of Statistics (PBS). Every number below is dated and linked to a source at the end. Where I could not find a reliable data point for a year, it is left blank rather than guessed.
Key takeaways
- From early January 2016 to 30 December 2025, gold per tola rose about 10.4 times in rupees (roughly 26.4% a year), the KSE-100 price index about 5.3 times (roughly 18.2% a year, excluding dividends), and consumer prices about 2.8 times (roughly 10.8% a year).
- A ten-year Defence Savings Certificate bought in December 2015 at the then-reported average rate of about 8.68% grew about 2.3 times before tax, which is less than inflation over the same ten years.
- Both gold and shares beat inflation over this window. Savings certificates, locked in at 2015 rates, did not.
- A large part of gold's rupee gain came from rupee depreciation: the dollar went from roughly Rs105 to Rs280.
- The answer changes with the dates. From the end-2016 close the KSE-100 was lower six years later; from end-2022 it gained over four times in three years. Treat the 10-year headline as one photograph, not a law.
What we measured, and how
The comparison uses a start at the beginning of 2016 and an end at the very end of 2025, so exactly ten years. Using calendar year-ends keeps the dates comparable across assets.
| Series | What it is | Source |
|---|---|---|
| KSE-100 | PSX benchmark price index, year-end close. Excludes dividends | PSX closing data as compiled by Wikipedia; 2025 close checked against APP |
| Gold | 24-karat price per tola (about 11.66 grams) quoted by Sarafa associations in the days around year-end | Dawn, ARY, Geo, Daily Times, Aaj, The News (each dated in the table) |
| Savings proxy | Ten-year Defence Savings Certificate, average rate set by the government from 1 December 2015 | Business Recorder, citing the National Savings notification |
| Inflation | CPI, December year-on-year change, as published by PBS | PBS monthly reviews and press coverage |
Two honest limits on the gold column. First, there is no single official daily gold price in Pakistan: the rate comes from Sarafa associations (All Sindh, All Pakistan, Karachi), and they can differ by a few thousand rupees on the same day. Second, I could not find a clean year-end rate for every year, so the table uses the nearest dated report in late December and says which date each one is.
The year-end data
| Year-end | KSE-100 (points) | Gold per tola (Rs) | Gold date and source | CPI, Dec year-on-year |
|---|---|---|---|---|
| 2015 (start) | 32,816 | 44,300 | First week of January 2016 (Dawn) | 3.2% |
| 2016 | 47,807 | not sourced | 3.7% | |
| 2017 | 40,471 | 56,200 | 28 Dec 2017 (Dawn) | 4.6% |
| 2018 | 37,067 | 67,000 | End 2018 (Dawn) | 6.2% |
| 2019 | 40,735 | 87,700 | 28 Dec 2019 (ARY) | 12.6% |
| 2020 | 43,755 | 113,650 | 30 Dec 2020 (Geo) | 8.0% |
| 2021 | 44,596 | 125,900 | 31 Dec 2021 (Daily Times) | 12.3% |
| 2022 | 40,420 | 178,800 | 20 Dec 2022 (Dawn) | 24.5% |
| 2023 | 62,451 | 220,900 | 30 Dec 2023 rate (Aaj) | 29.7% |
| 2024 | 115,127 | 272,600 | 30 Dec 2024 (The News) | 4.1% |
| 2025 | 174,054 | 459,462 | 30 Dec 2025 (The News) | 5.6% |
A few notes on reading it. The gold figure for 2022 is the 20 December report, not the last day of the year, and it was described by Dawn at the time as an all-time high with a local jeweller saying the rate was running above what the dollar rate implied. The 2015 starting gold figure is the first-week-of-January 2016 rate quoted by Dawn when world gold was about $1,062 an ounce, so it is a few days later than the KSE-100 start. Neither wrinkle changes the overall picture, but they are why this is a careful comparison and not an exact one.
CAGR in plain English
To compare an asset that grew for three years with one that grew for ten, you need a single yearly rate. That is what the compound annual growth rate (CAGR) gives you.
CAGR = (ending value / starting value) ^ (1 / years) - 1
Worked example for gold, using the table above:
- Divide the end by the start: 459,462 / 44,300 = 10.37. The price multiplied by about 10.4.
- Take the tenth root (raise to the power of 1/10): 10.37 ^ 0.1 = 1.2635.
- Subtract 1: 26.35% a year.
That does not mean gold rose 26% each year. It rose far more in some years than in others (The News reported a 68.5% increase in 2025 alone). CAGR is the steady rate that would give the same ten-year result.
Adjusting for inflation is one more line: real return = (1 + nominal CAGR) / (1 + inflation CAGR) - 1. For gold: 1.2635 / 1.1081 = 1.140, so a real return of about 14% a year.
Ten years, side by side
Applying the same formula to every series (start 2015/early 2016, end 30 December 2025):
| Multiple of start value | Nominal CAGR | Real CAGR (after CPI) | Rs 100,000 becomes | |
|---|---|---|---|---|
| Gold (per tola) | 10.4x | 26.4% | about 14.0% | about Rs 1,037,000 |
| KSE-100 (price index) | 5.3x | 18.2% | about 6.6% | about Rs 530,000 |
| 10-year Defence Savings Certificate (pre-tax) | 2.3x | 8.68% | about -1.9% | about Rs 230,000 |
| Consumer prices (CPI) | 2.8x | 10.8% | n/a | what Rs 100,000 of 2015 spending costs: about Rs 279,000 |
The last row is the benchmark. To merely keep up, Rs 100,000 had to become roughly Rs 279,000. Gold and the KSE-100 cleared that comfortably; the savings certificate fell short, ending with about 82% of its starting purchasing power.
How the inflation figure was built: I chained the PBS December year-on-year readings for 2016 to 2025 (3.7, 4.57, 6.17, 12.63, 7.97, 12.28, 24.5, 29.7, 4.1, 5.6 per cent). PBS changed the CPI base year from 2007-08 to 2015-16 during this period, so a chained approximation can differ slightly from a direct index-to-index comparison, but not enough to change any conclusion here.
The rupee is a big part of the story
Between the end of 2015 and 30 December 2025 the rupee moved from roughly Rs105 per dollar (about Rs104.84 on 31 December 2015 on a free-currency-rate archive; Dawn reported an intraday 2015 high of Rs106.10 that October) to Rs280.12 on the interbank market on 31 December 2025 (APP). That is about 2.7 times more rupees per dollar, or a loss of about 63% of the rupee's dollar value.
Gold is priced in dollars worldwide, so a weaker rupee lifts it automatically. World gold went from about $1,062 an ounce in early January 2016 (Dawn) to about $4,371 on 30 December 2025 (The News), roughly 4.1 times. Multiply that by the rupee's 2.7 times and you land near 11 times, close to the 10.4 times the local tola rate actually delivered. Dawn made the same point at the end of 2018: the world price fell $19 an ounce that year, yet the local tola rose Rs11,600 because the rupee weakened.
The same lens applies to shares. Measured in dollars, the KSE-100's ten-year gain shrinks to about 2.0 times (roughly 7.1% a year) because the rupee fell so much. This matters if you are a foreign investor, or a Pakistani saving toward dollar costs such as education abroad, which is why foreign investors watch the dollar rate so closely. Business Recorder reported, for example, that in 2023 the KSE-100 gained nearly 55% in rupees but about 24% in US dollars.
Why the answer changes with the dates
A ten-year result is sensitive to where you stand at each end. Here is the same calculation over shorter windows ending at the same point (30 December 2025):
| Window | Gold CAGR | KSE-100 CAGR | What was happening |
|---|---|---|---|
| End-2015 to end-2025 (10 years) | 26.4% | 18.2% | Gold ahead |
| End-2017 to end-2025 (8 years) | 30.0% | 20.0% | KSE-100 started after a 2017 peak, gold still ahead |
| End-2020 to end-2025 (5 years) | 32.2% | 31.8% | Almost a tie |
| End-2022 to end-2025 (3 years) | 37.0% | 62.7% | Shares well ahead |
| End-2023 to end-2025 (2 years) | 44.2% | 66.9% | Shares well ahead |
The KSE-100 closed 2016 at 47,807 and 2022 at 40,420, a fall of about 15% over six years in nominal terms, while consumer prices rose roughly 89% over the same stretch (the chained CPI level of 1.957 at end-2022 divided by 1.037 at end-2016). Anyone who bought at the 2016 close would have waited until 2023 to see a new high. Then the index went from 40,420 at end-2022 to 174,054 at end-2025, a rise of 4.3 times in three years, a period that coincided with IMF programmes and easing interest rates.
Gold's path was steadier in direction but not painless. Dawn reported that gold fell Rs61,050 per tola over two days on 30 and 31 January 2026, to Rs511,862, after touching a record near $5,600 an ounce earlier that week. A buyer at the January 2026 peak was suddenly sitting on a loss, which is a reminder that the 10-year multiple hides violent swings. The same applies to the KSE-100, which has had sharp drops of its own.
What this does and does not tell you
It does show that over a decade with persistent high inflation (peaking near 30% in 2023), keeping money only in fixed-rate savings tools set in a low-rate year lost purchasing power, while assets linked to the dollar price or to company earnings kept pace or beat it.
It does not show that gold or shares will repeat this, for several reasons:
- Start and end dates. Pick a different window and the ranking changes (see the table above).
- A rising-rate environment helps new savers. Savings certificates bought later, when rates were much higher, had different results from one locked in at 8.68% in 2015. The SBP policy rate moved up to 22% in 2023 and was 10.5% at the end of 2025.
- Risk is not in the CAGR. The KSE-100 fell about 15% from its end-2016 close to end-2022, and on 2 March 2026 it closed 9.57% lower in a single session. Gold has had its own drawdowns. A savings certificate does not swing, but its real value can erode.
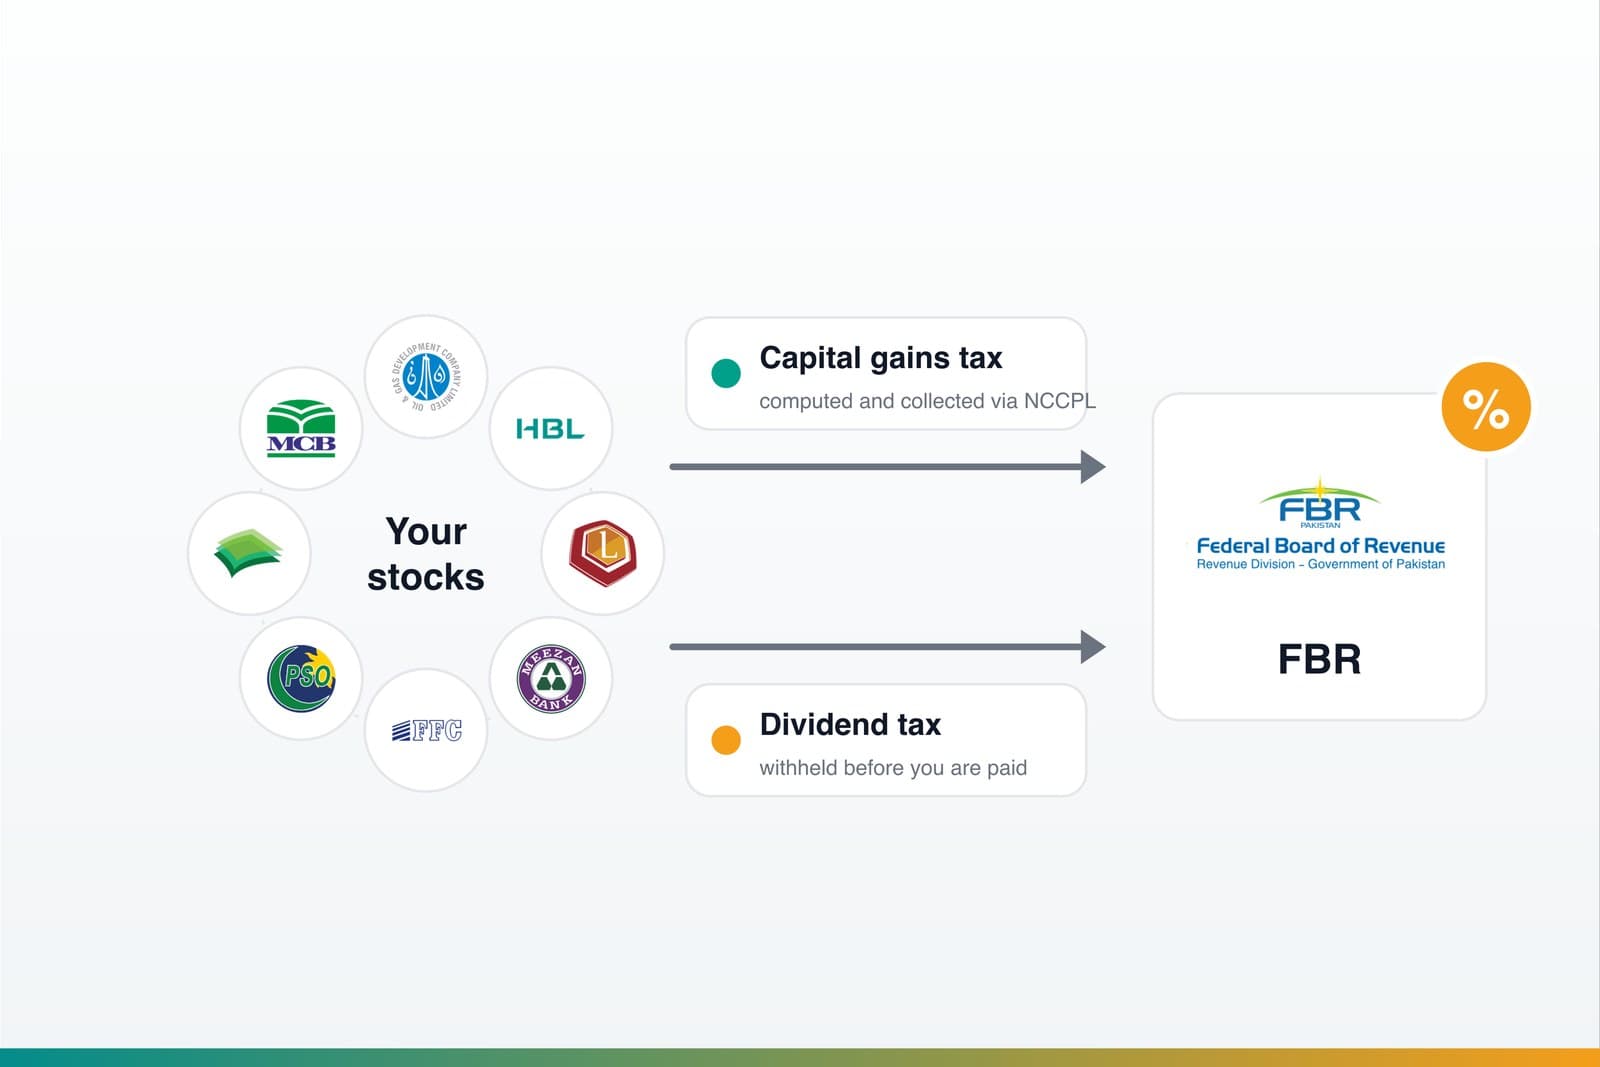
- Costs and tax differ. Brokerage and CGT apply to shares (see our fees guide), making charges and jeweller spreads apply to physical gold, and profit tax applies to National Savings. None of these are in the table.
- Averages hide your experience. Hardly anyone buys at the exact start and holds to the exact end. Regular investing, rebalancing and the date you actually need the money all change the outcome.
A balanced way to use this
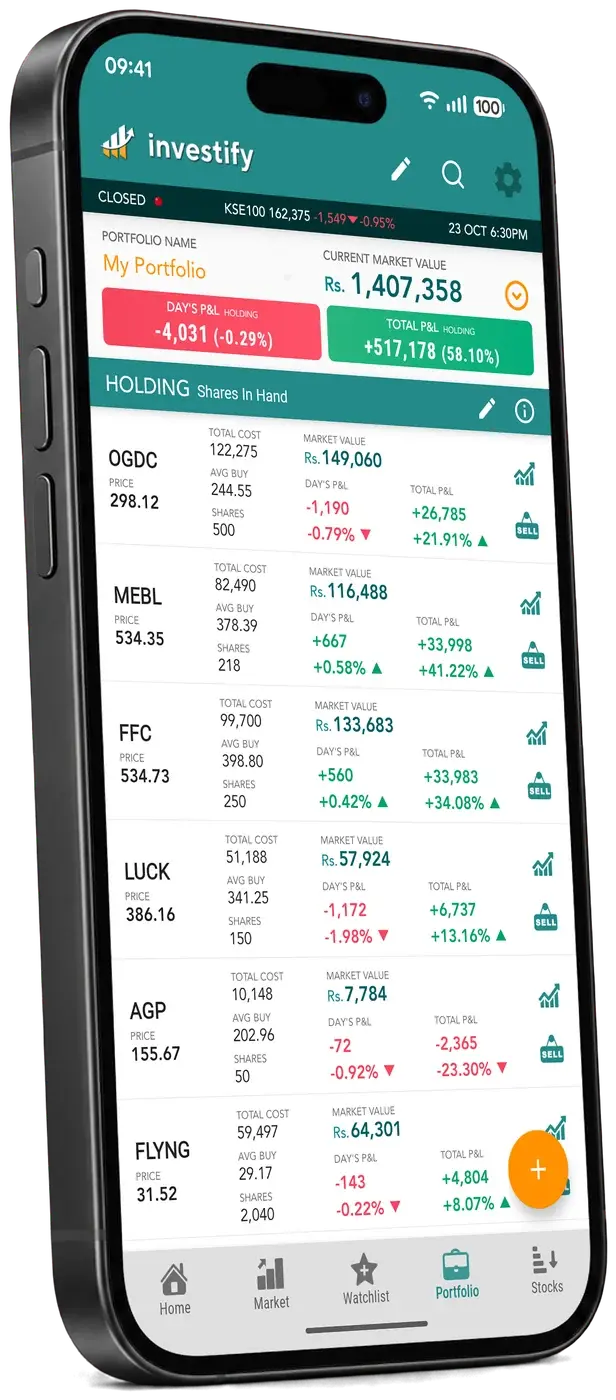
Many investors treat the three as different tools rather than rivals: a savings or low-risk portion for money needed soon, equities for long-horizon growth that can outrun inflation, and gold as a store of value that tends to follow the dollar price and the rupee. How much of each is a personal decision based on your goals, timeline, tax position and tolerance for drawdowns. A portfolio tracker helps you see what you actually hold and how it has behaved, and Investify's Fear & Greed index includes a "safe haven demand" signal that compares recent equity performance with gold priced in rupees and USD/PKR, so you can watch the same relationship day to day.
Track your PSX holdings against the benchmark
See your portfolio, watchlist, live KSE-100 level and market news in one place with a free Investify account.
Open the portfolio trackerEducational note
This article is general educational information, not financial, investment or tax advice, and it does not recommend buying or selling gold, shares, certificates or any other asset. Figures are historical, are drawn from the dated public sources listed below, and are rounded for readability. Past performance does not guarantee future results. Gold rates in Pakistan vary by association and time of day; year-end KSE-100 values and CPI readings can be revised or restated by their publishers; and the CPI chain and CAGR figures are the author's own arithmetic. Verify any figure against the original source before relying on it, and consult a qualified adviser about your own situation. Investify is a PSX market-data and portfolio-tracking app and is not a broker, bullion dealer or National Savings agent.
The bottom line
Over the ten years to the end of 2025, gold per tola (about 10.4 times) and the KSE-100 price index (about 5.3 times) both beat Pakistan's roughly 2.8 times rise in consumer prices, while a ten-year Defence Savings Certificate locked in at the December 2015 rate (about 2.3 times, before tax) did not. Gold led on that exact window, helped by a rupee that lost about 63% of its dollar value; shares led over the last three years. The sensible takeaways are about method rather than a winner: use CAGR and real returns, check the start and end dates, remember what each number leaves out, and judge each asset by the job you need it to do.
Related reading
Sources and references
- The News - Gold prices increase 68.5pc in 2025 to Rs459,462 per tolaAll Pakistan Sarafa Gems and Jewellers Association rates for 30 Dec 2024 (Rs272,600) and 30 Dec 2025 (Rs459,462); world gold $4,371.
- Dawn - Per tola gold price hits Rs50,000 againFirst week of January 2016: Rs44,300 per tola with world gold at $1,062.
- Dawn - Gold reaches two-year high of Rs56,200/tolaAll Sindh Sarafa Association rate, late December 2017.
- Dawn - Gold prices soar by Rs11,600 per tola in 2018Year-end 2018 rate of Rs67,000 and the rupee context.
- ARY News - Gold prices in Pakistan register a sizable dip on weekend28 December 2019: Rs87,700 per tola.
- Geo News - Gold rates, 30 December 2020Rs113,650 per tola at close on 30 December 2020.
- Daily Times - Gold rate in Pakistan on 31 December 2021Rs125,900 per tola, Karachi Sarafa market.
- Dawn - Gold price in Pakistan hits all-time high of Rs178,800 per tola20 December 2022 rate, All Sindh Sarafa Jewellers Association.
- Aaj News - Latest Pakistan gold rates for December 30Published 29 December 2023: Rs220,900 per tola for 30 December.
- Dawn - Gold sheds Rs61,050 per tola in two days31 January 2026 fall to Rs511,862 after a record near $5,600 an ounce.
- Wikipedia - KSE 100 IndexYear-end closing values, 2015 to 2025.
- APP - PSX sheds 418 points to close at 174,054 points31 December 2025 KSE-100 close.
- Geo News - KSE-100 soars 84% in CY242024 close of 115,126.90.
- Pakistan Bureau of Statistics - monthly CPI reviewsDecember year-on-year CPI for 2016, 2019 and 2021 (see also the 2016 and 2019 reviews cited above).
- Business Recorder - Pakistan's headline inflation clocks in at 24.5% in DecemberDecember 2022 CPI.
- Profit - CPI inflation soars to 29.7% YoY in DecemberDecember 2023 CPI.
- ARY News - Pakistan records 5.6% inflation in December 2025December 2025 CPI, citing PBS.
- Business Recorder - National Savings rates revised from 1 December 2015Defence Savings Certificates average rate of about 8.68%.
- APP - Rupee gains 03 paisa against US dollarInterbank close of Rs280.12 on 31 December 2025.